Edit chart
Loading graph
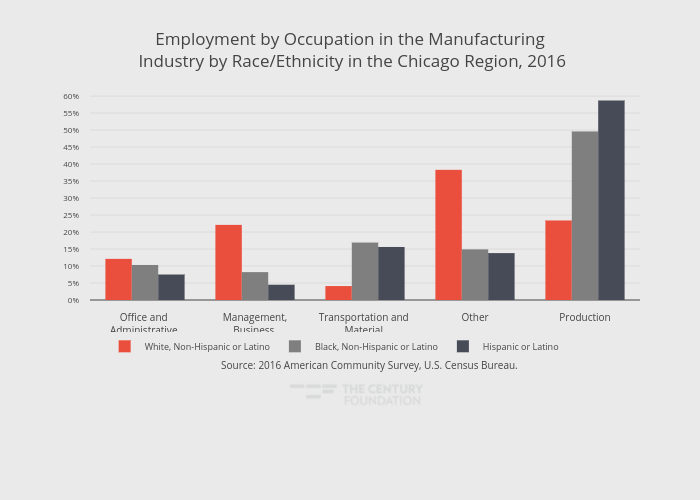
Thecenturyfoundation's interactive graph and data of "Employment by Occupation in the Manufacturing Industry by Race/Ethnicity in the Chicago Region, 2016" is a grouped bar chart, showing White, Non-Hispanic or Latino, Black, Non-Hispanic or Latino, Hispanic or Latino; with in the x-axis. The x-axis shows values from -0.5 to 4.5. The y-axis shows values from 0 to 61.78947368421053. This visualization has the following annotation: Source: 2016 American Community Survey, U.S. Census Bureau.