Edit chart
Loading graph
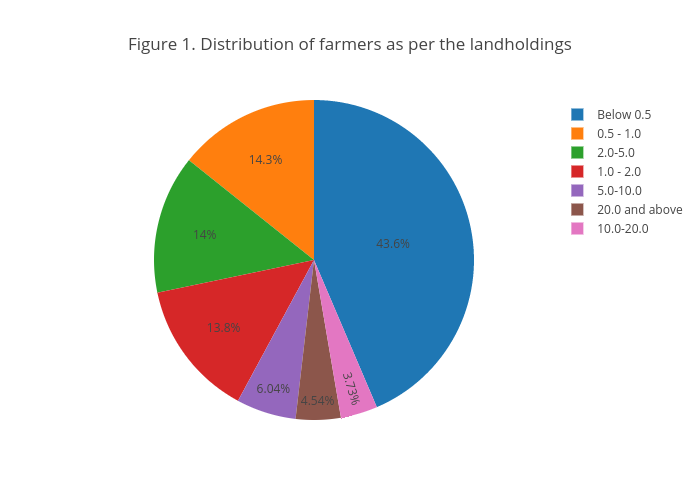
Tomersk's interactive graph and data of "Figure 1. Distribution of farmers as per the landholdings" is a pie, showing B. The x-axis shows values from 0 to 0. The y-axis shows values from 0 to 0.