Edit chart
Loading graph
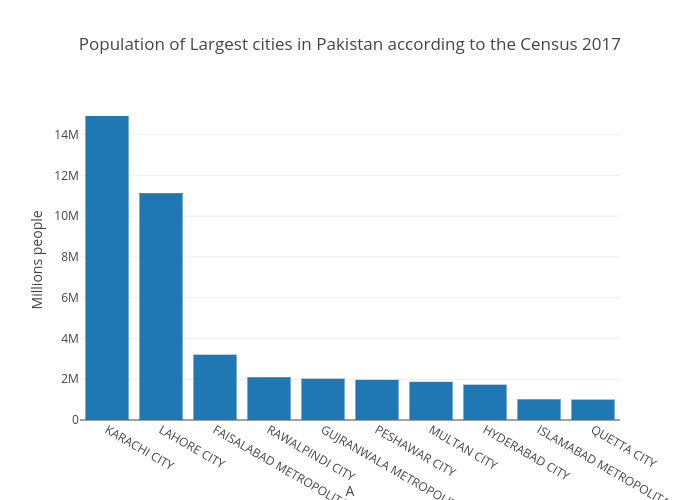
Townplanneradeel's interactive graph and data of "Population of Largest cities in Pakistan according to the Census 2017" is a bar chart, showing B; with A in the x-axis and Millions people in the y-axis.. The x-axis shows values from -0.5 to 9.5. The y-axis shows values from 0 to 15695107.368421054.