Edit chart
Loading graph
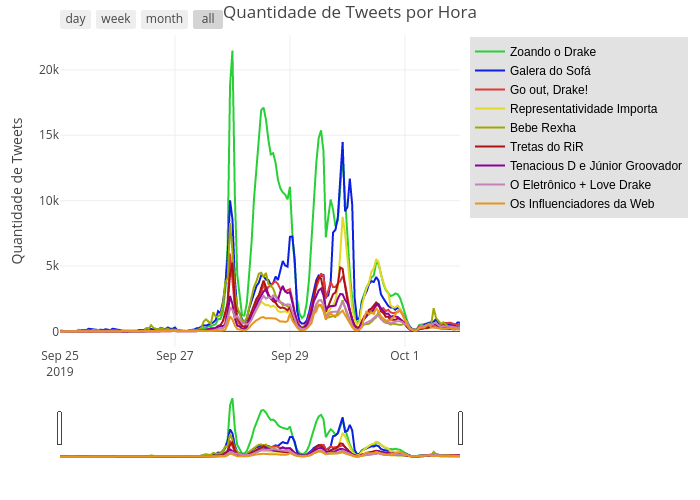
Trifenol's interactive graph and data of "Quantidade de Tweets por Hora" is a line chart, showing Zoando o Drake, Galera do Sofá, Go out, Drake!, Representatividade Importa, Bebe Rexha, Tretas do RiR, Tenacious D e Júnior Groovador, O Eletrônico + Love Drake, Os Influenciadores da Web; with [] in the x-axis and Quantidade de Tweets in the y-axis.. The x-axis shows values from 2019-09-25 to 2019-10-01 23:00. The y-axis shows values from -1193.0555555555554 to 22668.055555555555.