Edit chart
Loading graph
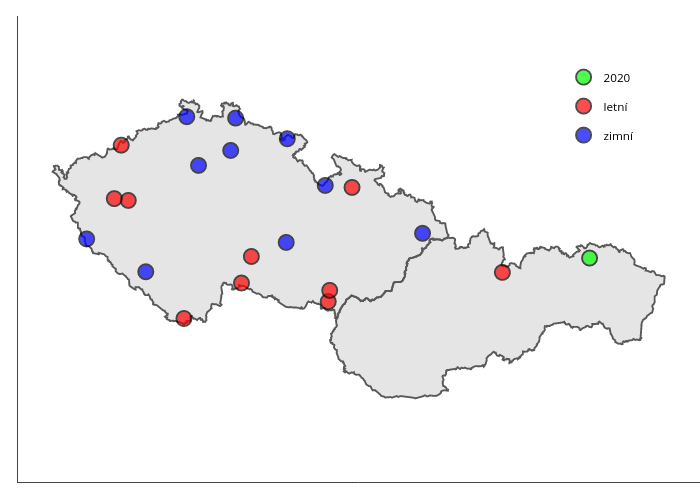
Vencalek's interactive graph and data of "2020, letní, zimní" is a line chart, showing 2020, letní, zimní. The x-axis shows values from 11.566956 to 23.090644. The y-axis shows values from 47.565193425 to 51.221661075. This visualization has the following annotation: Termín