Edit chart
Loading graph
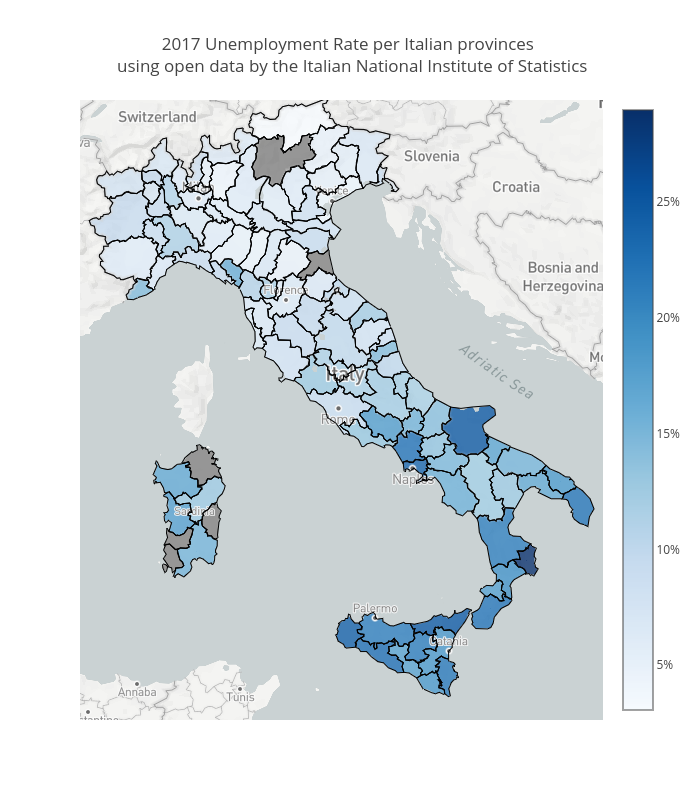
Vincenzo.pota's interactive graph and data of "2017 Unemployment Rate per Italian provinces using open data by the Italian National Institute of Statistics" is a scattermapbox. The x-axis shows values from 0 to 0. The y-axis shows values from 0 to 0.