Edit chart
Loading graph
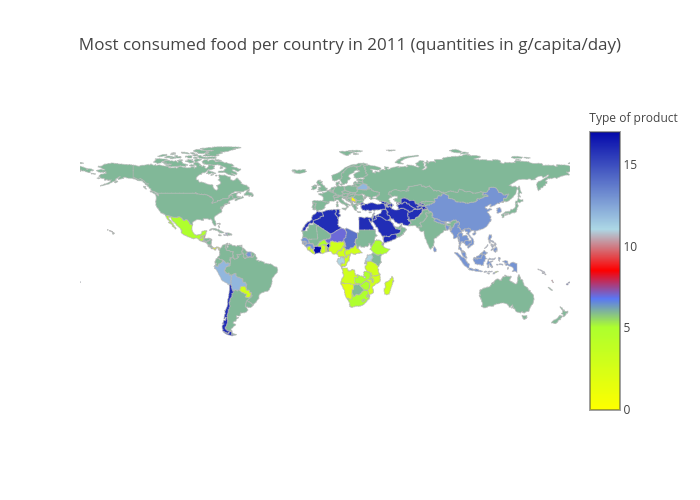
Warsaw's interactive graph and data of "Most consumed food per country in 2011 (quantities in g/capita/day)" is a choropleth. The x-axis shows values from 0 to 0. The y-axis shows values from 0 to 0.