Edit chart
Loading graph
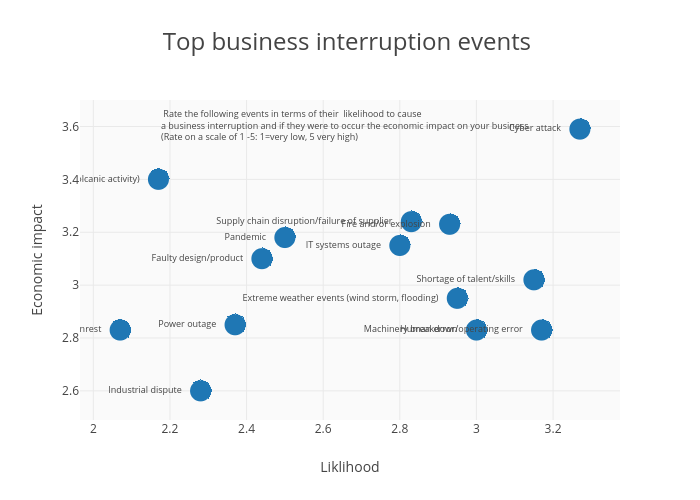
Wsanders's interactive graph and data of "Top business interruption events " is a , showing C; with Liklihood in the x-axis and Economic impact in the y-axis.. The x-axis shows values from 1.9769441302872652 to 3.363055869712735. The y-axis shows values from 2.493391420911528 to 3.6966085790884717. This visualization has the following annotation: Rate the following events in terms of their likelihood to cause a business interruption and if they were to occur the economic impact on your business (Rate on a scale of 1 -5: 1=very low, 5 very high)