Edit chart
Loading graph
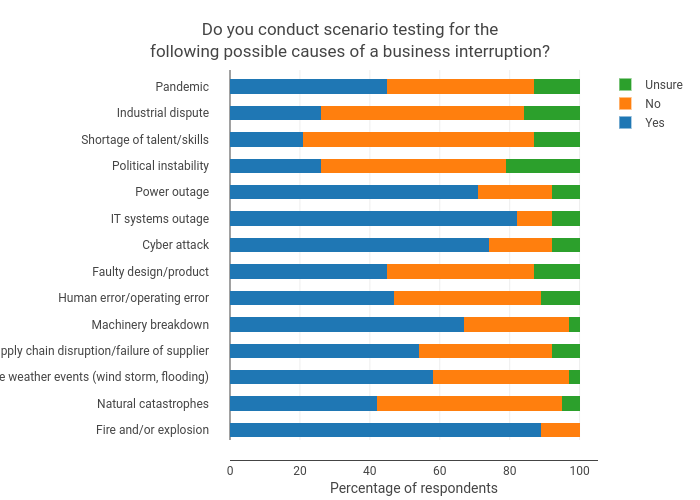
Wsanders's interactive graph and data of "Do you conduct scenario testing for thefollowing possible causes of a business interruption?" is a stacked bar chart, showing Yes, No, Unsure; with Percentage of respondents in the x-axis and in the y-axis.. The x-axis shows values from 0 to 105.26315789473684. The y-axis shows values from -0.37652916073968706 to 13.623470839260314.