Import Data
A step-by-step guide for entering or importing data into the Chart Studio Workspace.
Option 1 - Enter the Data directly into the Grid
The first step to making any Chart Studio graph is adding data to the grid. You can type your data directly into the grid, or copy it from a spreadsheet and paste it in.
You can also type directly into the cells, or use your keyboard shortcuts to paste in clipboard content.

Option 2 - Import a Data File
You can import .xls, .xlsx, or .csv files directly into Chart Studio. Head to Chart Studio Workspace and click on the 'Import' button next to your username in the top-right corner of the workspace.

The 'Import' modal will appear, where you can upload your local data-file saved in the above mentioned format under the 'Upload' tab. You can either click the 'Upload' button or simply drag and drop the file into the window within the modal.

Option 3 - Import Data from a URL
You can upload data by entering the URL of an online data set. Please note that Chart Studio supports only secured URLs (HTTPS) and accepted file formats are same as mentioned above: .xls, .xlsx, or .csv.

Option 4 - Import Data via Falcon SQL Client
You can import data by connecting to your SQL database through the Falcon SQL client. To learn more about how to connect your databases to your chart via Falcon, check out this section.

Option 5 - Import Data from the Examples
You can also use the example data provided under the 'Examples' tab in the 'Import' modal. Choose any of these examples to get started!

Option 6 - Import Data from a URL using Chart Studio's External Endpoint
Additionally, you can upload data from a URL using Chart Studio's external endpoint. Entering https://plot.ly/external/?url=YOUR_URL in your browser will open your data in Chart Studio's workspace. This method for uploading and parsing your data doesn't impose the same SSL restrictions that you may encounter with the above import method. For example, open this link to load data from Chart Studio's dataset repo into Chart Studio's online workspace: https://plot.ly/external/?url=https://raw.githubusercontent.com/plotly/datasets/master/2011_us_ag_exports.csv.
Update Data
When you edit the data in the grid, your plot will update automatically.
The folowing video illustrates a simple use case where the plot updates when a data point is typed directly into the grid.

Work with Multiple Grids
You can also work with multiple grids with each grid containing data imported from any of the above mentioned sources. After adding all the necessary data required for the chart, click on the '+ Trace' button at the top right-hand side of the Chart Studio Workspace panel and then choose the 'Type' of trace you'd like to work with.

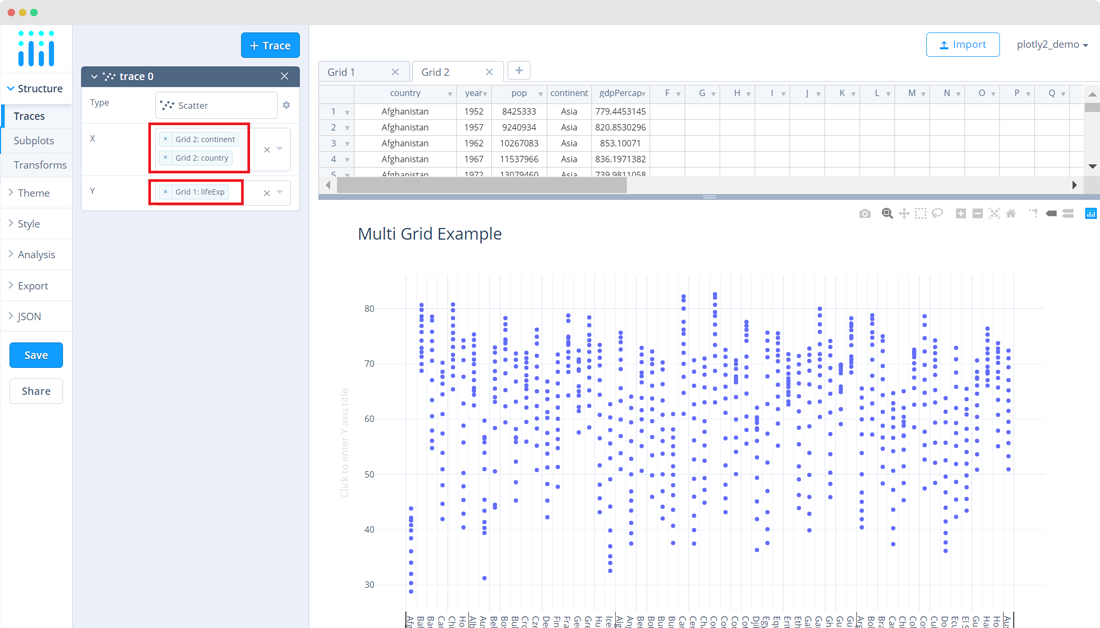
When you select the X and Y values from their dropdown, make sure to select them under their specific grid. In the image below, you'll see that we've added 'X' values from Grid 2 and 'Y' values from Grid 1.
In addition to adding your data from different grids to the trace, you can also associate them to the trace's style attributes such as marker size, marker color, colorscale, etc.

Note that if you want to save your plot with all your grids, you must include data from each grid into a trace. If not, your saved plot will open with only the grids that are associated to it.
Don't forget to save your plot and name your file!

