Bubble Charts
A type of scatter chart that displays three dimensions of data.
Add Data
Bubble charts are scatter plots with an added size dimension, thus three dimensional data is represented as x position, y position, and size of the marker.
Head to Chart Studio's Chart Studio to get started. You have the option of typing directly in the grid, uploading your local file, or entering a URL of an online dataset. Chart Studio accepts .xls, .xlsx, or .csv files. For more information on how to enter your data, see this tutorial.
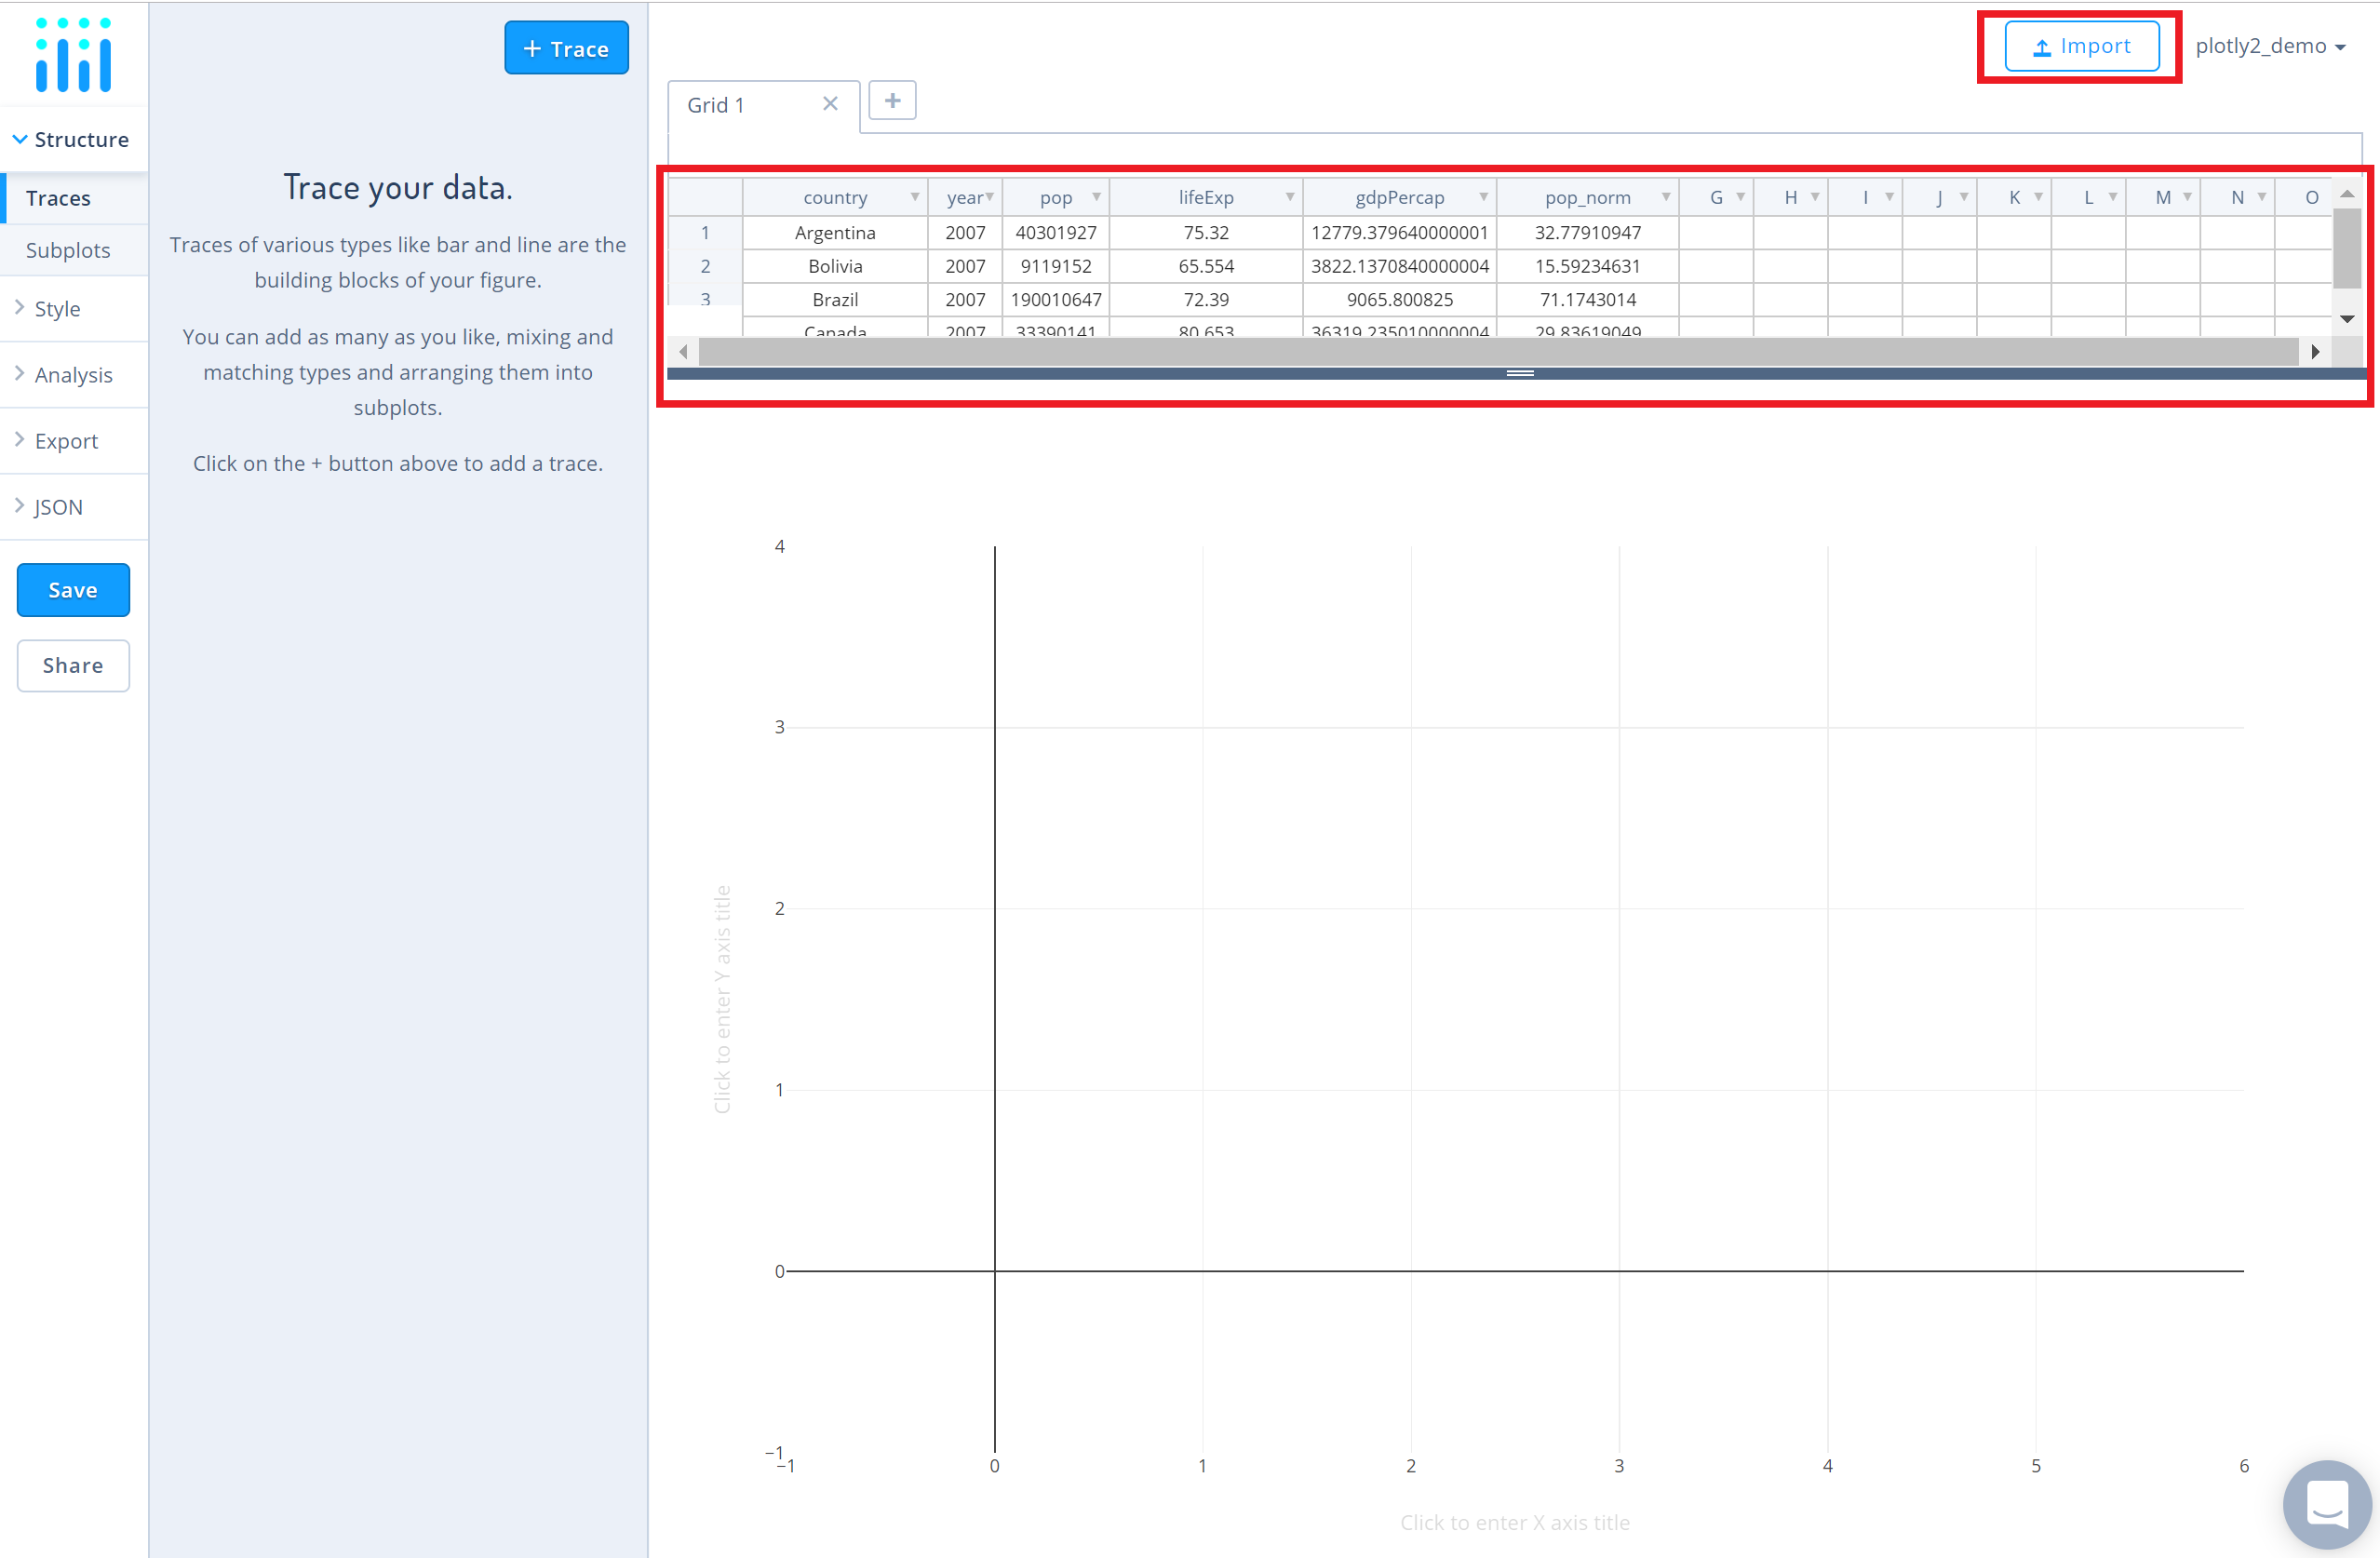
You can also use the data featured in this tutorial by clicking on 'Open This Data in Chart Studio' on the left-hand side. It'll open in Chart Studio.
Create Chart
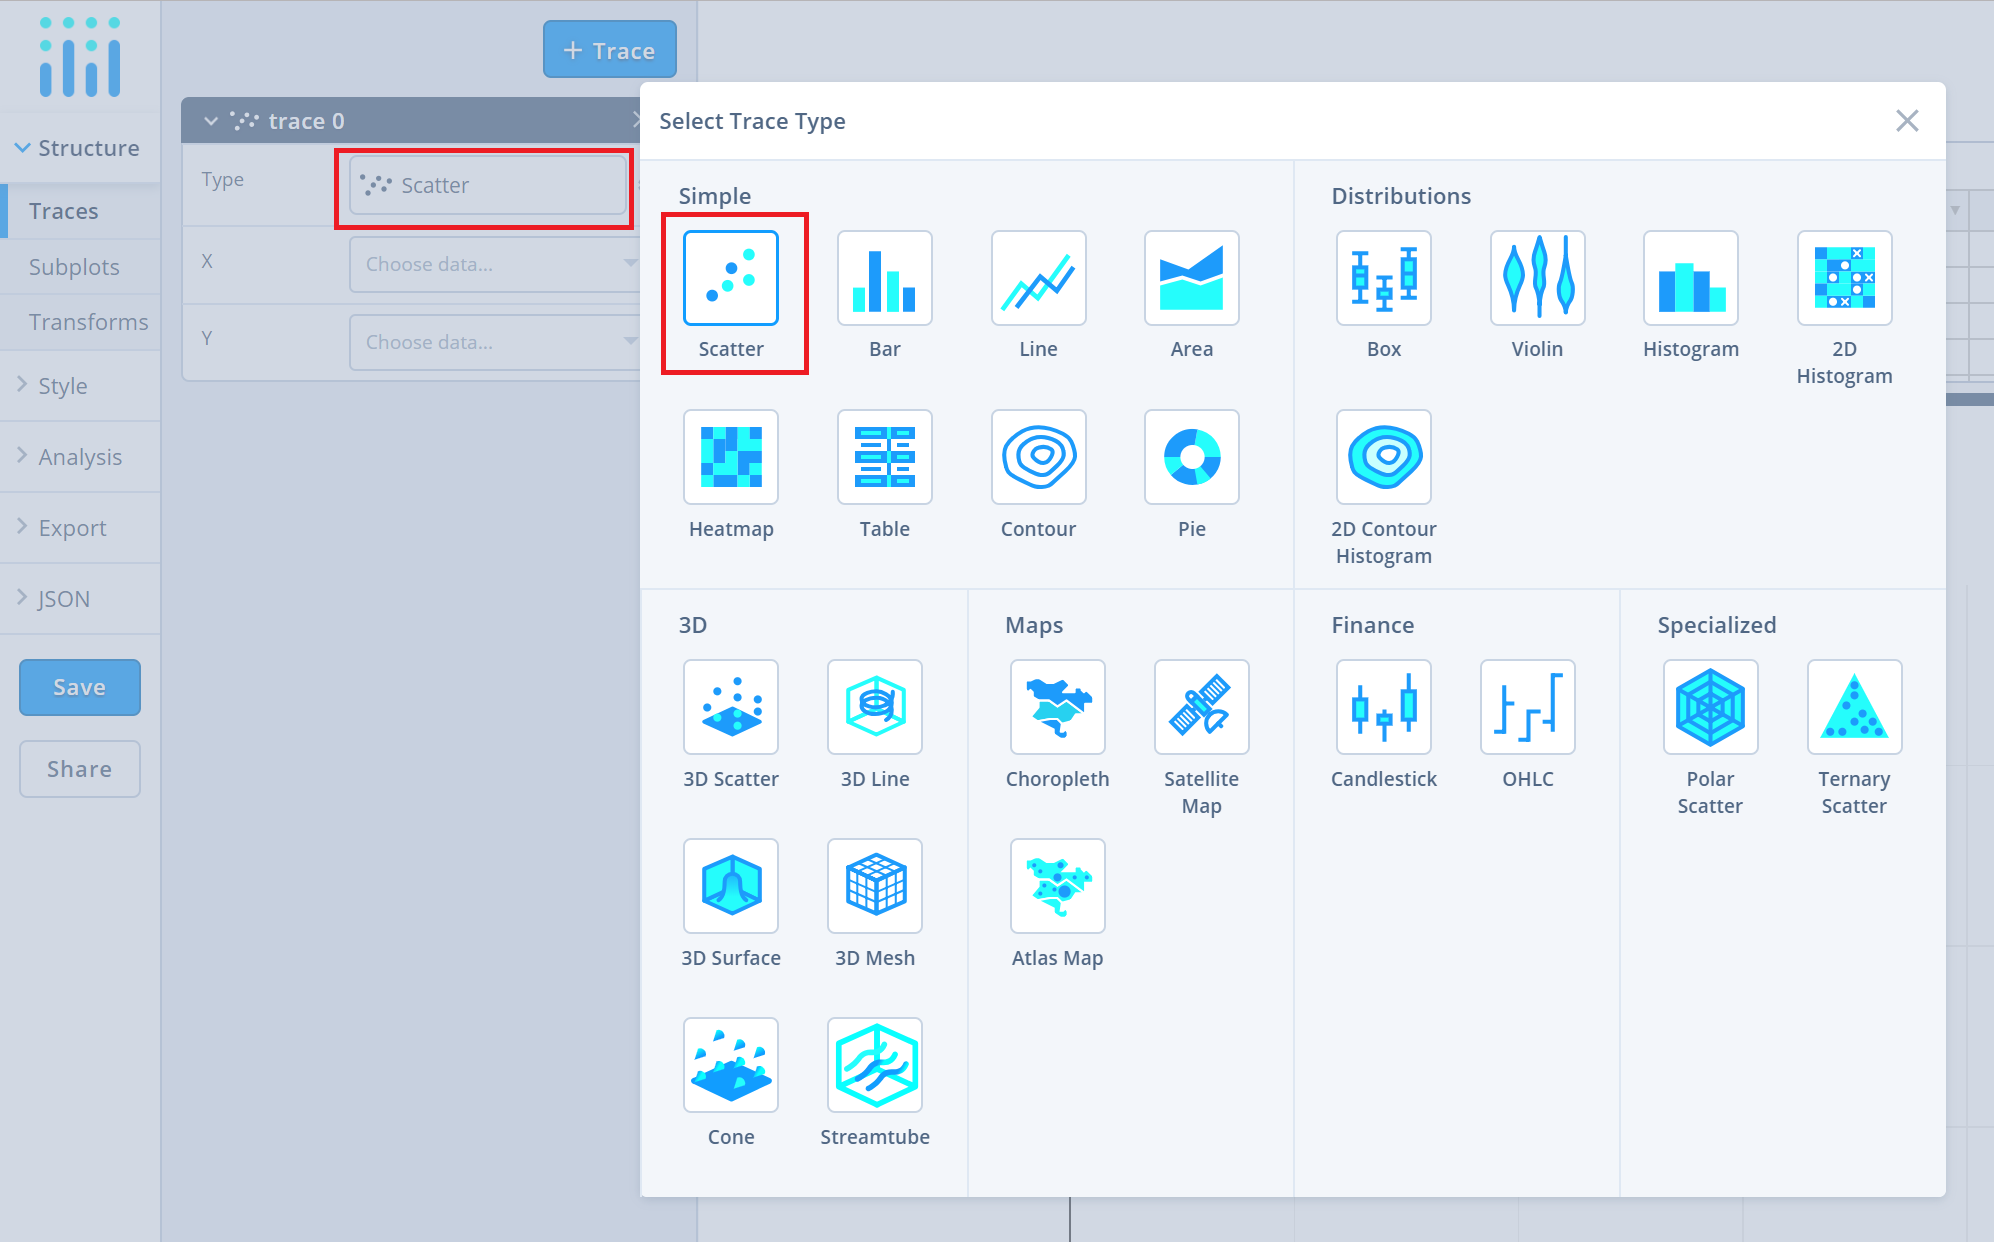
After adding data, go to the 'Traces' section under the 'Structure' menu on the left-hand side. Choose the 'Type' of trace. To create a bubble chart, choose 'Scatter' under 'Simple' trace type.
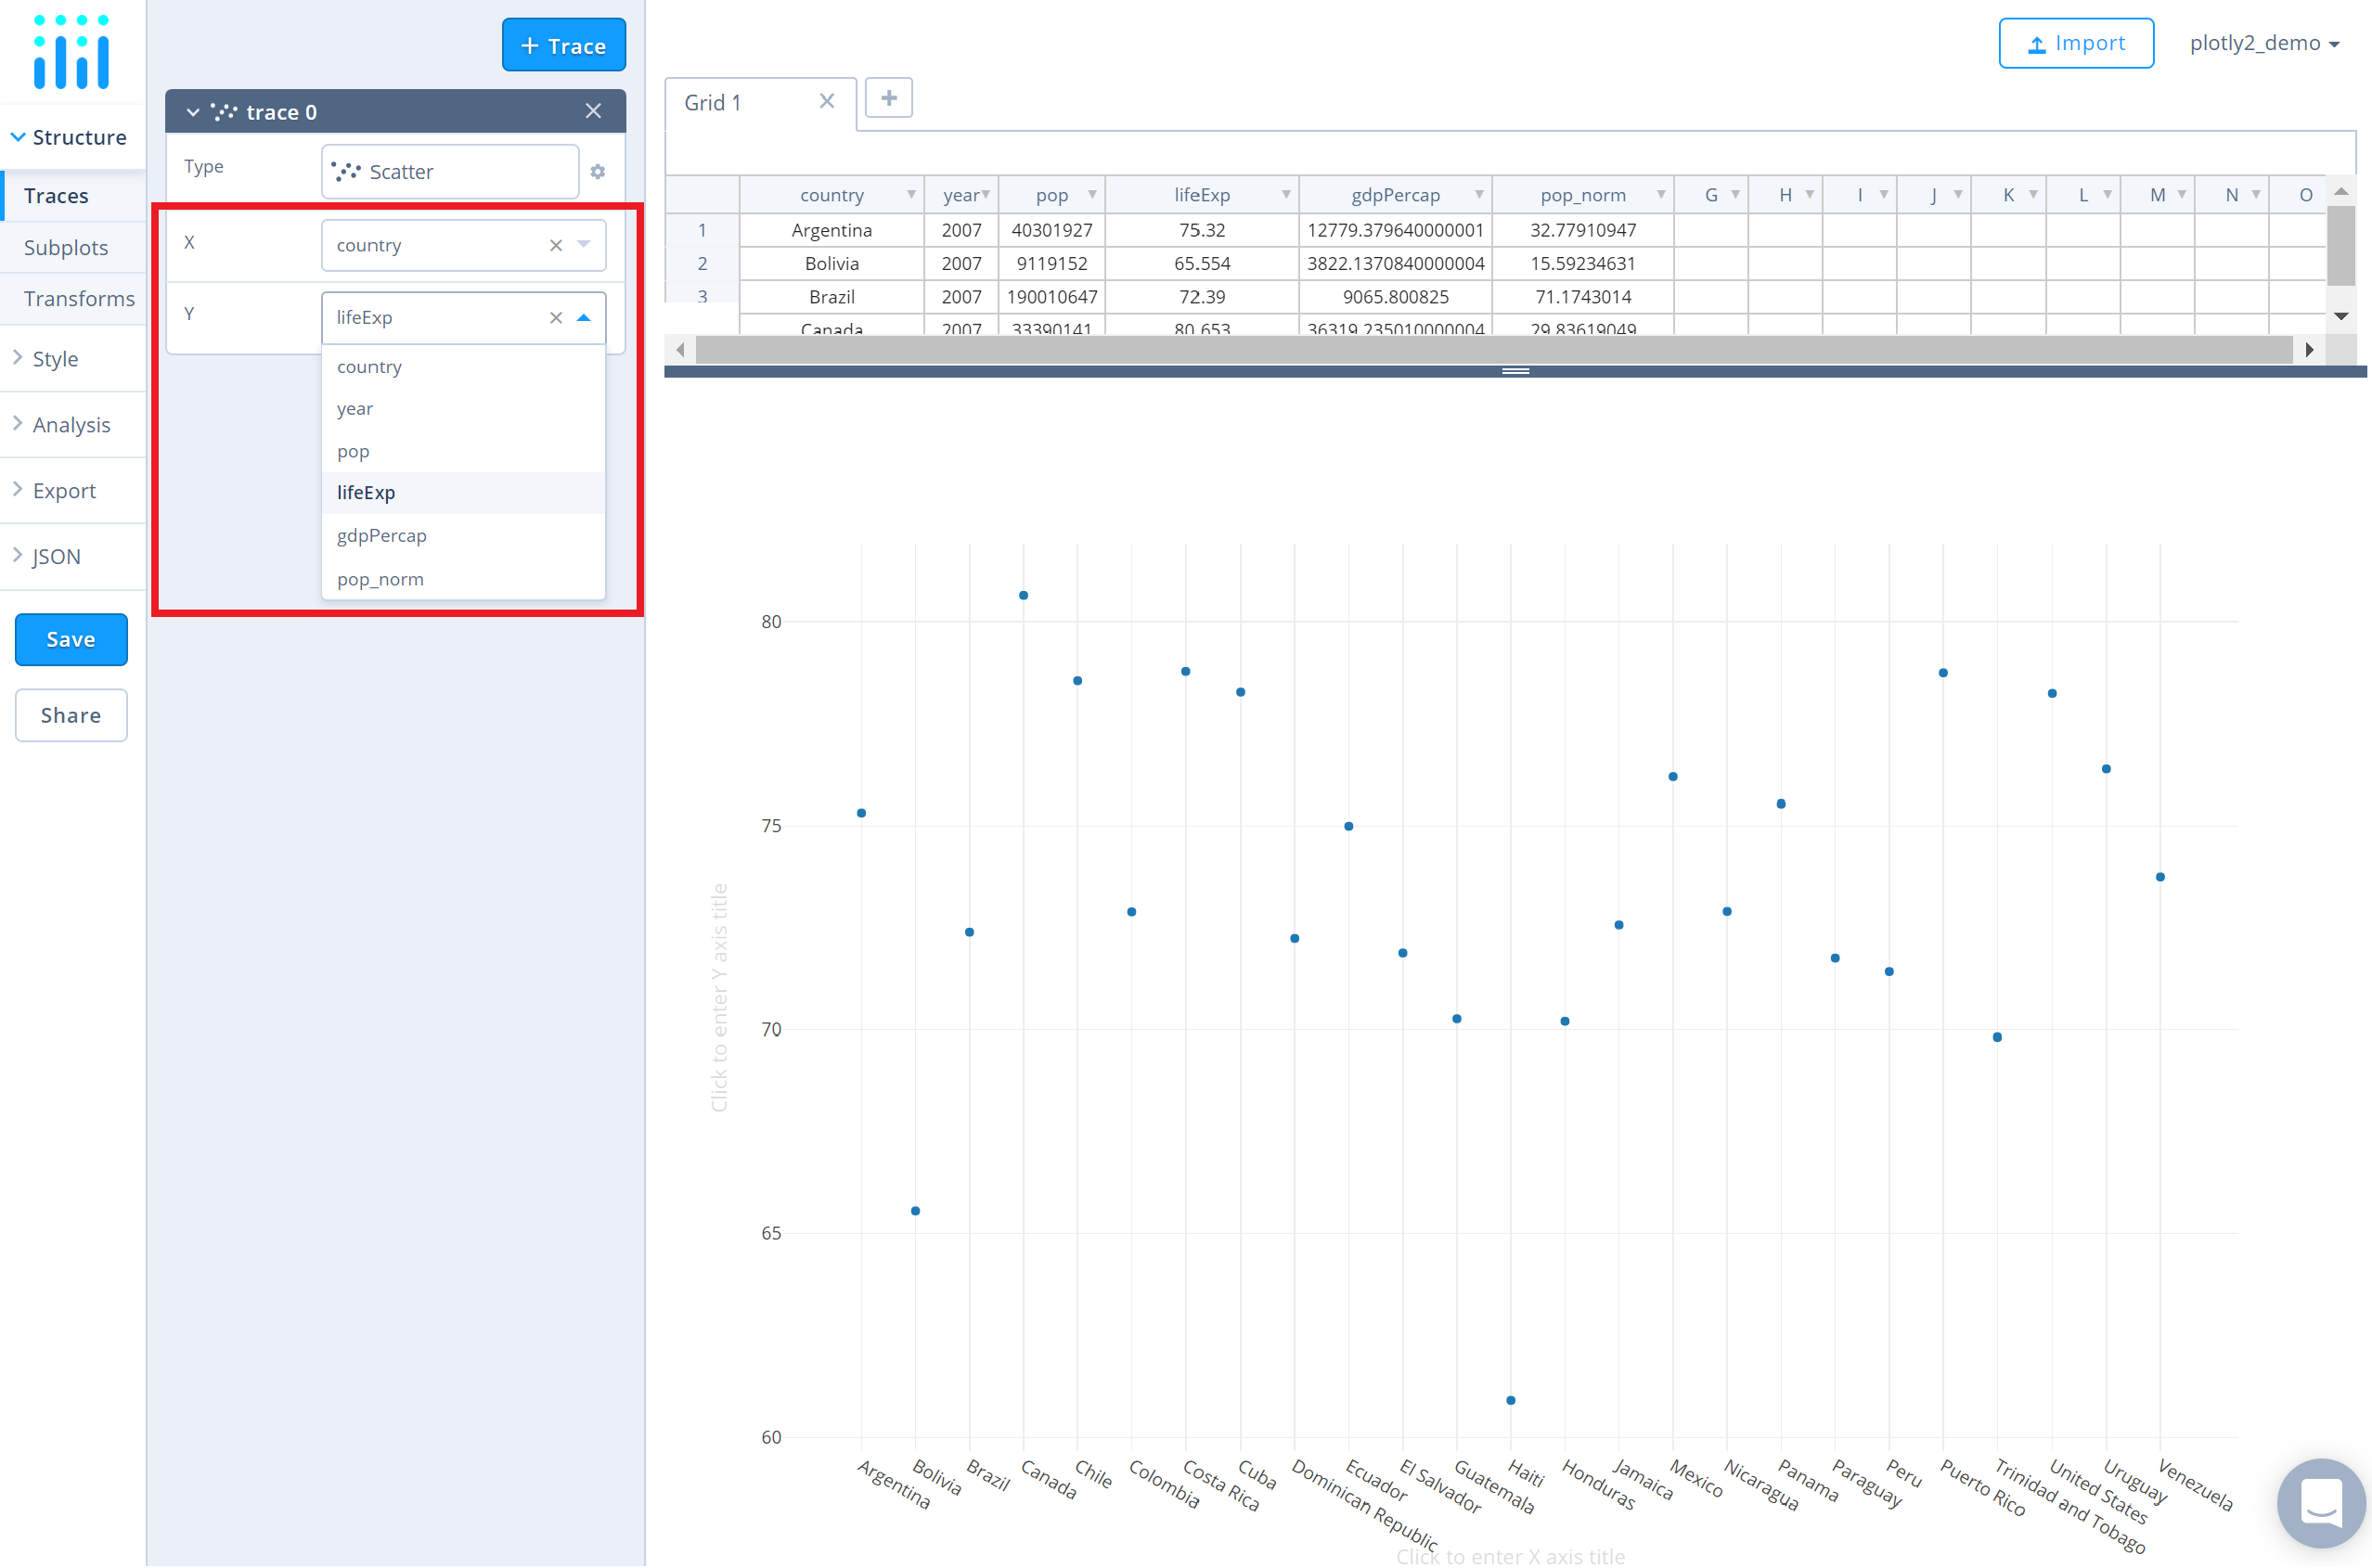
Next, select 'X' and 'Y' values from the dropdown menus. This will create a raw scatter trace, as seen below.
Style Trace
The 'Style' menu displays many options to modify characteristics of the overall chart layout or the individual traces. To see more options about styling the chart visit the style and layout section of the Chart Studio documentation.
In order to create a bubble chart, change the size of the markers. There are two modes: 'Constant' or 'Variable'. To set a varying size for the markers based on a dimension of data, click on 'Variable' and select the desired column name from the dropdown menu.
Set Titles
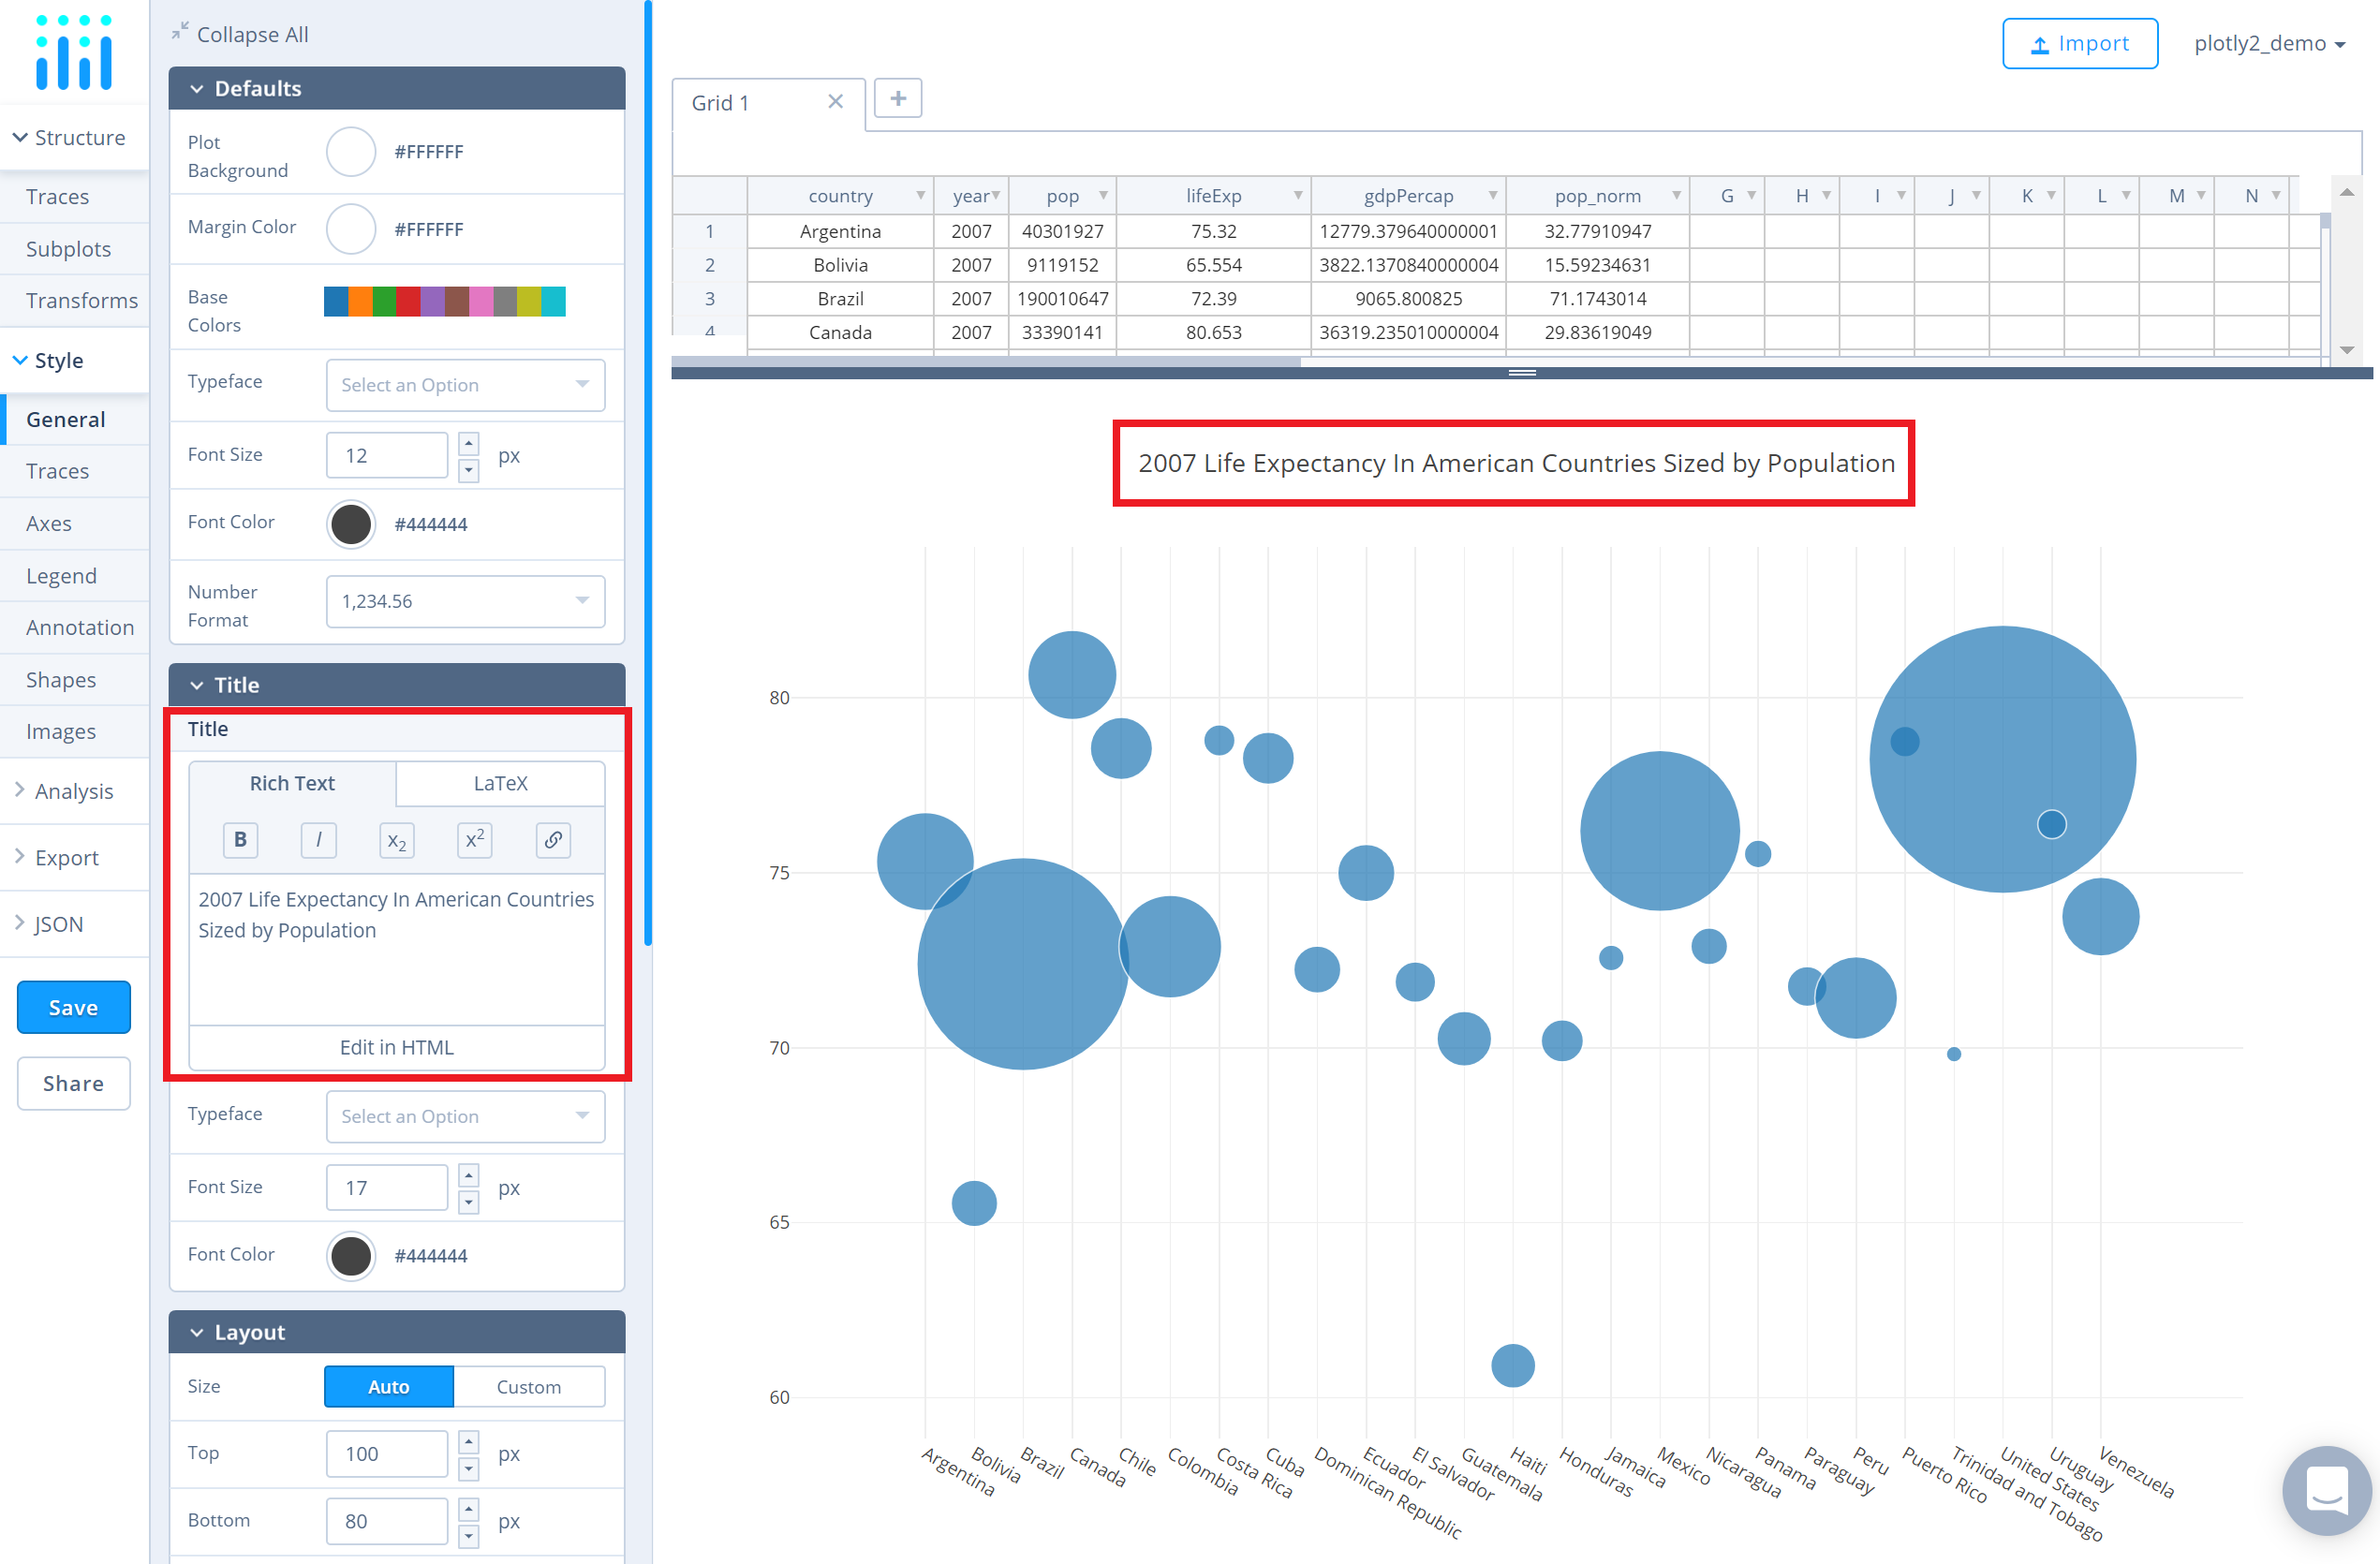
To set the plot title, go to the 'General' section under the 'Style' menu and type in the plot title within the textbox provided under 'Title'.
To set the axes titles, go to the 'Axes' section under the 'Style' menu and type in the axis title within the textbox provided under 'Title' for each axis.
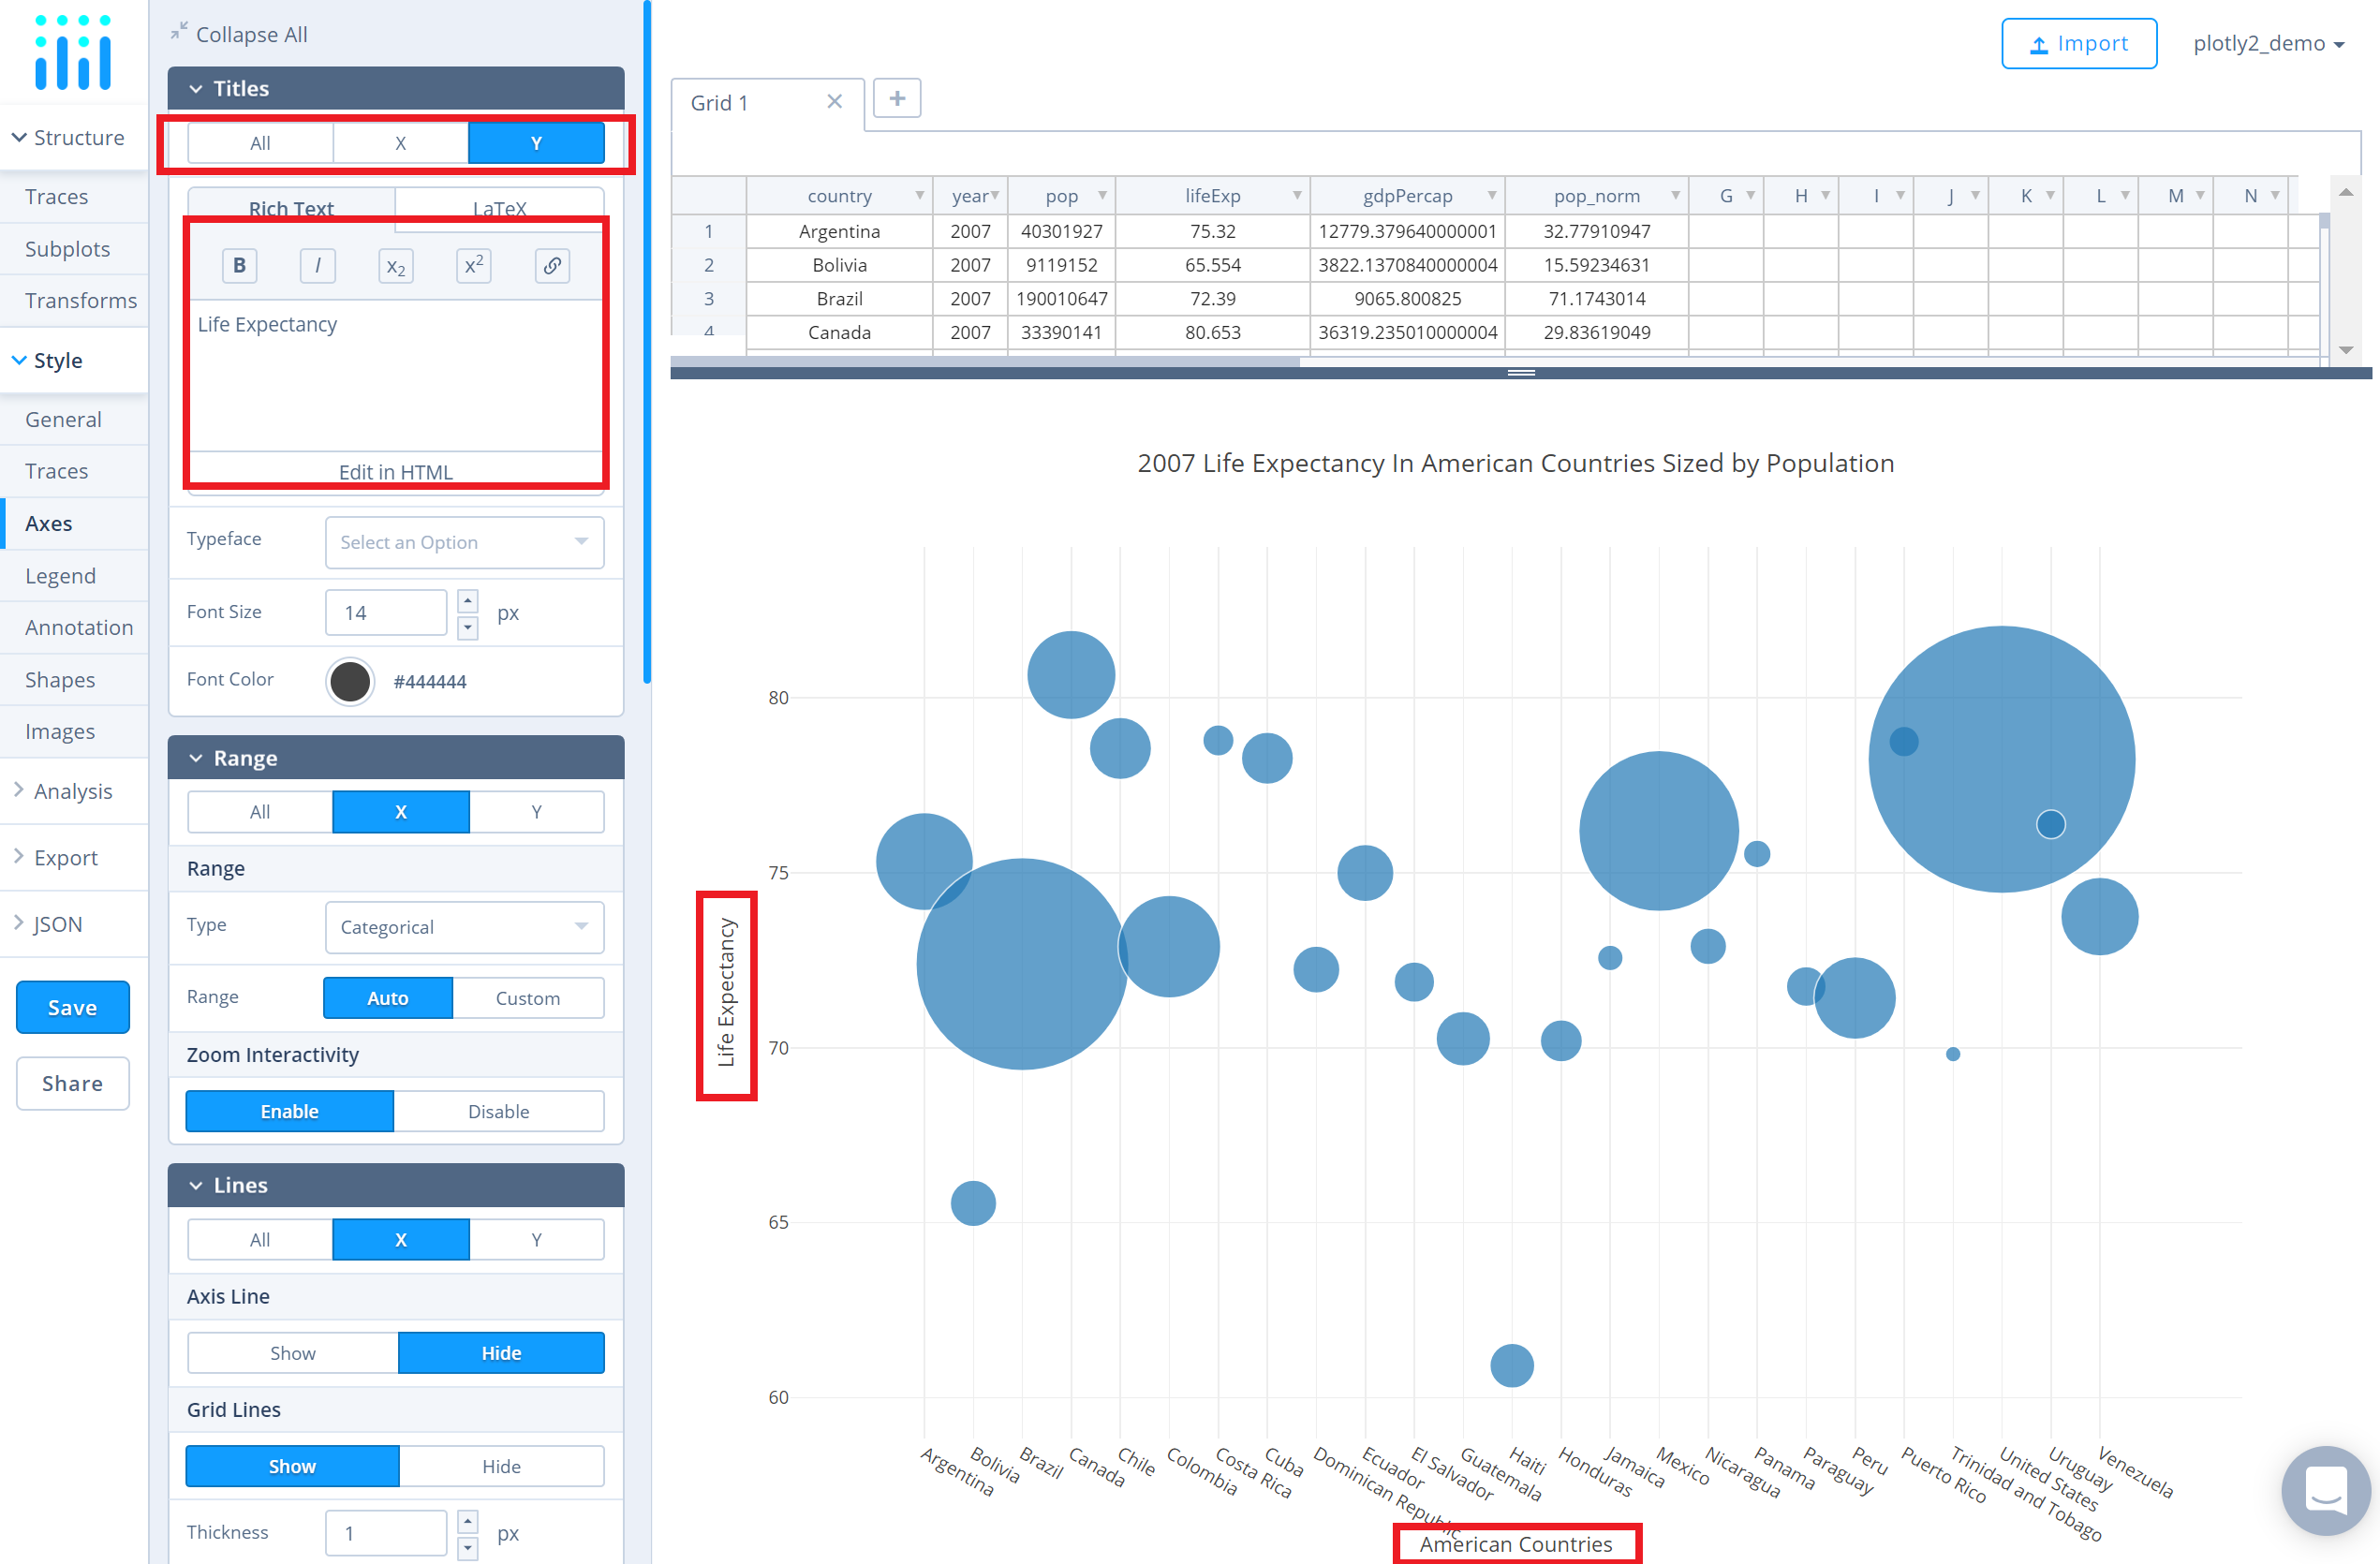
Another approach is to click and then enter the title directly on the plot interface.
Save and Share
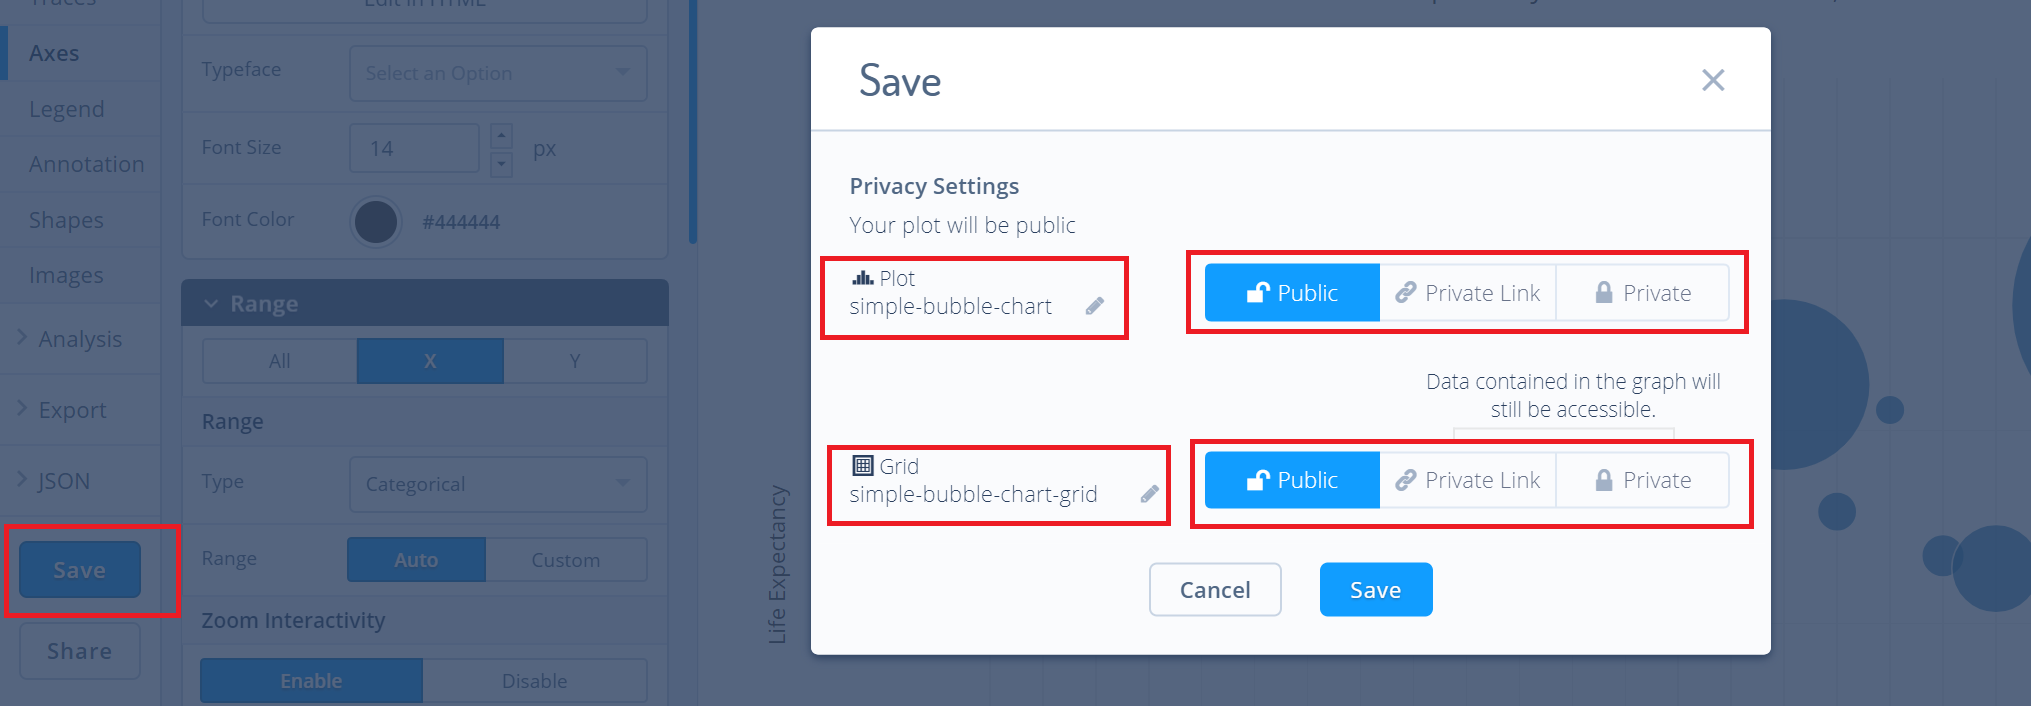
Now, the bubble chart has been created. To save the plot click the 'Save' button on the left-hand side. A save modal will appear, as seen below, where you can specify the filenames and privacy settings for your plot and data grid.
For more information on privacy settings and how sharing works, visit Chart Studio's sharing tutorial.
