Plotly Python Open Source Graphing Library Statistical Charts
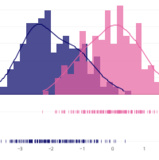
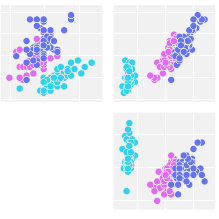
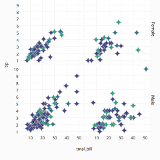
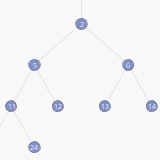
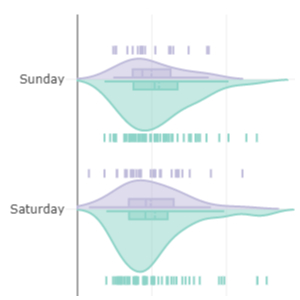
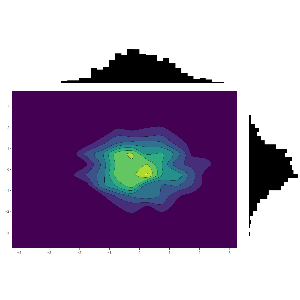
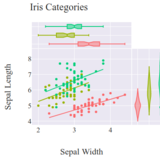
Plotly's Python graphing library makes interactive, publication-quality graphs online. Examples of how to make statistical charts such as box plots, histograms, and distrubution plots.
Deploy Python AI Dash apps on private Kubernetes clusters: Pricing | Demo | Overview | AI App Services
Statistical charts in Dash
Dash is the best way to build analytical apps in Python using Plotly figures. To run the app below, run pip install dash, click "Download" to get the code and run python app.py.
Get started with the official Dash docs and learn how to effortlessly style & deploy apps like this with Dash Enterprise.


