

Click Events in Python
Click Events With FigureWidget
Plotly Studio: Transform any dataset into an interactive data application in minutes with AI. Sign up for early access now.
Update Points Using a Click Callback
In [1]:
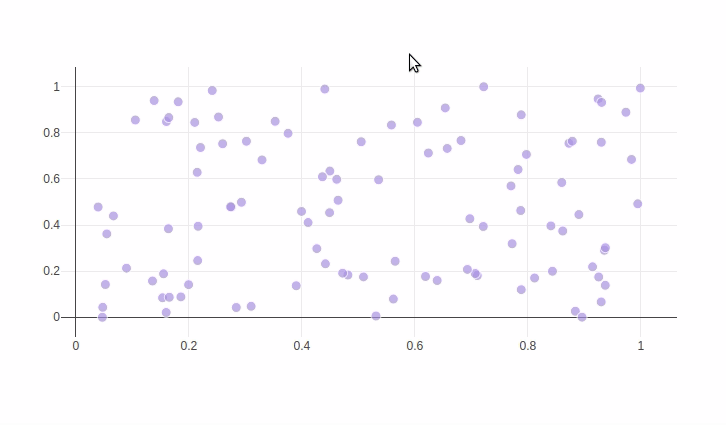
import plotly.graph_objects as go
import numpy as np
np.random.seed(1)
x = np.random.rand(100)
y = np.random.rand(100)
f = go.FigureWidget([go.Scatter(x=x, y=y, mode='markers')])
scatter = f.data[0]
colors = ['#a3a7e4'] * 100
scatter.marker.color = colors
scatter.marker.size = [10] * 100
f.layout.hovermode = 'closest'
# create our callback function
def update_point(trace, points, selector):
c = list(scatter.marker.color)
s = list(scatter.marker.size)
for i in points.point_inds:
c[i] = '#bae2be'
s[i] = 20
with f.batch_update():
scatter.marker.color = c
scatter.marker.size = s
scatter.on_click(update_point)
f
Out[1]:
Reference
See these Jupyter notebooks for even more FigureWidget examples.
In [2]:
import plotly.graph_objects as go
f = go.FigureWidget([go.Scatter()])
help(f.data[0].on_click)
What About Dash?
Dash is an open-source framework for building analytical applications, with no Javascript required, and it is tightly integrated with the Plotly graphing library.
Learn about how to install Dash at https://dash.plot.ly/installation.
Everywhere in this page that you see fig.show(), you can display the same figure in a Dash application by passing it to the figure argument of the Graph component from the built-in dash_core_components package like this:
import plotly.graph_objects as go # or plotly.express as px
fig = go.Figure() # or any Plotly Express function e.g. px.bar(...)
# fig.add_trace( ... )
# fig.update_layout( ... )
from dash import Dash, dcc, html
app = Dash()
app.layout = html.Div([
dcc.Graph(figure=fig)
])
app.run(debug=True, use_reloader=False) # Turn off reloader if inside Jupyter
