Edit chart
Loading graph
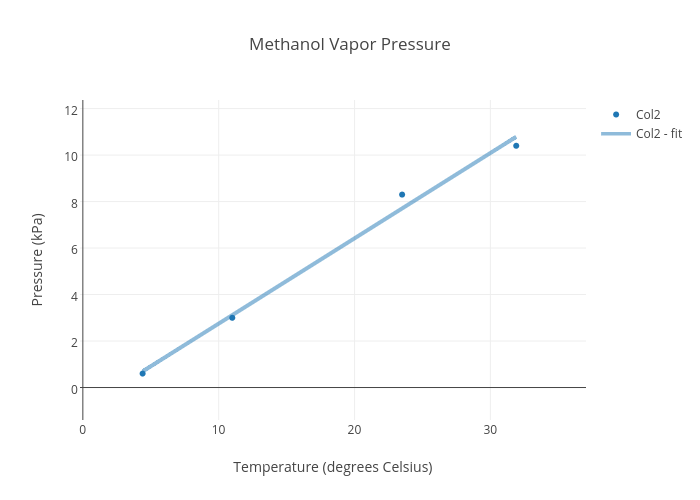
17berowskia's interactive graph and data of "Methanol Vapor Pressure" is a scatter chart, showing Col2 vs Col2 - fit; with Temperature (degrees Celsius) in the x-axis and Pressure (kPa) in the y-axis.. The x-axis shows values from -0.20930836732864222 to 37.03586633072204. The y-axis shows values from -1.397412638066757 to 12.368842572160865.