Edit chart
Loading graph
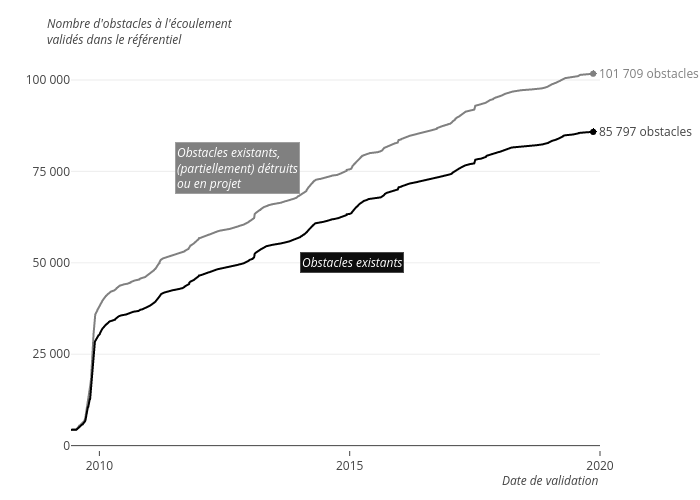
Afb-dataviz's interactive graph and data is a line chart. The x-axis shows values from 2009-06-08 to 2020-01-01. The y-axis shows values from 0 to 0. This visualization has the following annotations: Nombre d'obstacles à l'écoulementvalidés dans le référentiel; Date de validation; Obstacles existants,(partiellement) détruitsou en projet; Obstacles existants,(partiellement) détruitsou en projet; Obstacles existants; Obstacles existants; 101 709 obstacles; 85 797 obstacles