Edit chart
Loading graph
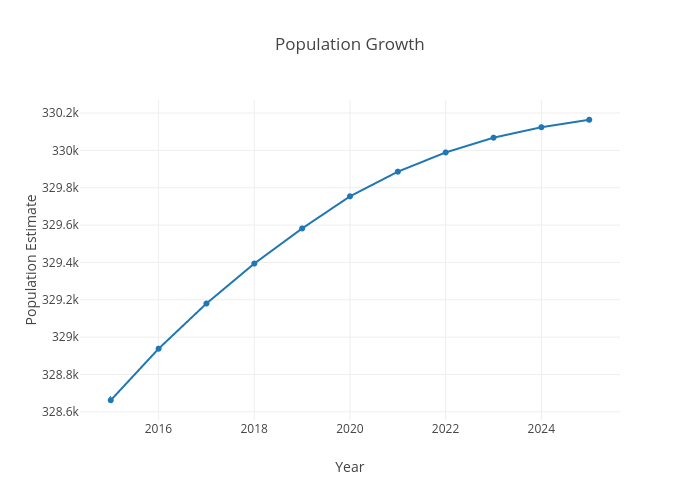
Aaronsmith's interactive graph and data of "Population Growth" is a line chart, showing D; with Year in the x-axis and Population Estimate in the y-axis.. The x-axis shows values from 2014.3990410809633 to 2025.6009589190367. The y-axis shows values from 328564.69435215945 to 330261.30564784055.