Edit chart
Loading graph
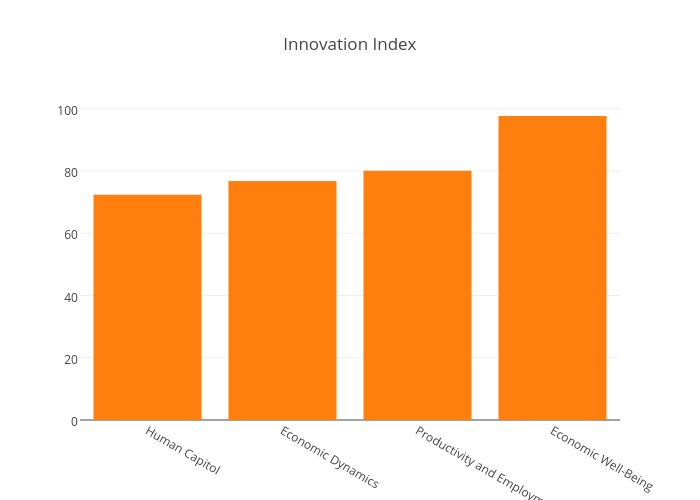
Aaronsmith's interactive graph and data of "Innovation Index" is a bar chart, showing B. The x-axis shows values from -0.5 to 3.5. The y-axis shows values from 0 to 102.84210526315789.