Edit chart
Loading graph
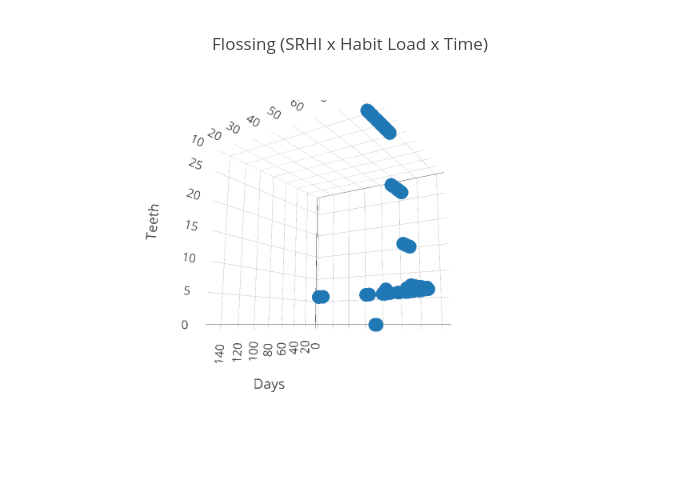
Agdragon01's interactive graph and data of "Flossing (SRHI x Habit Load x Time)" is a scatter3d. The x-axis shows values from -1 to 6. The y-axis shows values from -1 to 4.