Edit chart
Loading graph
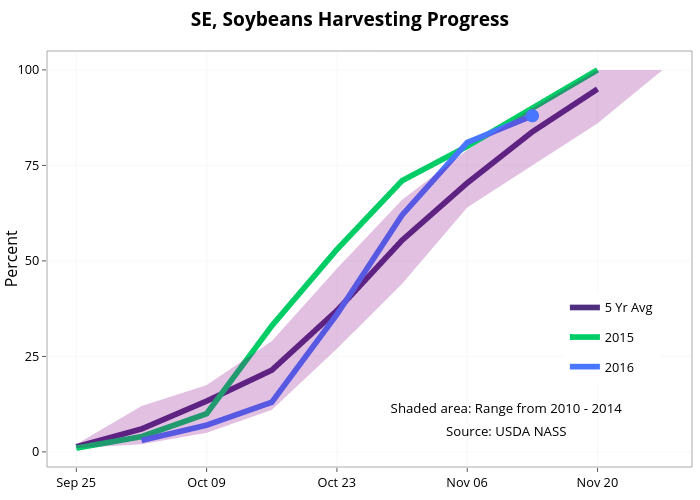
Agmanager's interactive graph and data of " SE, Soybeans Harvesting Progress " is a line chart, showing 5 Yr Avg, 2015, 2016, , , , ; with Percent in the y-axis. The x-axis shows values from 38.55 to 48.45. The y-axis shows values from -3.95 to 104.95.