Edit chart
Loading graph
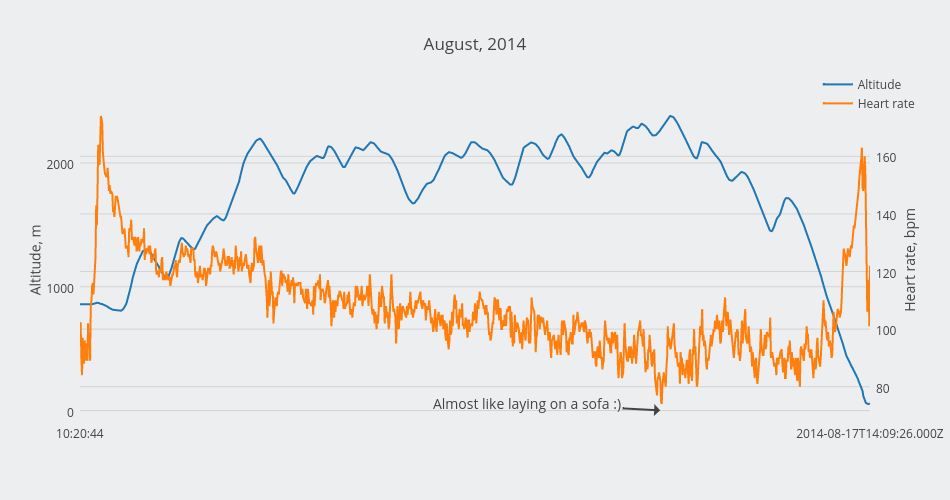
Alexandraserebrennikova's interactive graph and data of "August, 2014" is a scatter chart, showing Altitude vs Heart rate; with Altitude, m in the y-axis. The x-axis shows values from 0 to 1172. The y-axis shows values from -76.22222222222223 to 2508.222222222222. This visualization has the following annotation: Almost like laying on a sofa :)