Edit chart
Loading graph
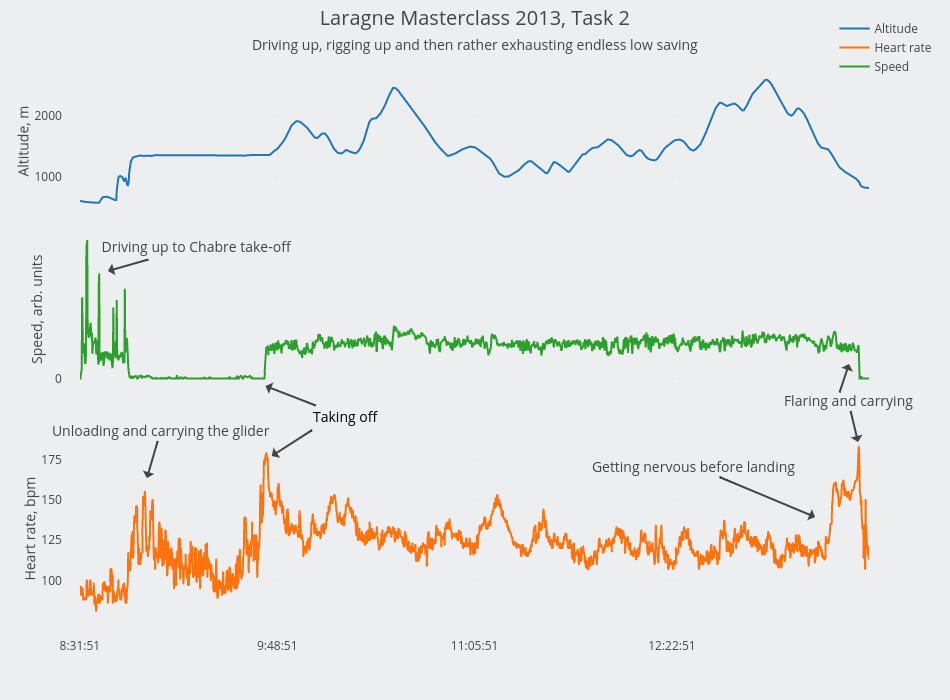
Alexandraserebrennikova's interactive graph and data of "Laragne Masterclass 2013, Task 2" is a scatter chart, showing Altitude, Heart rate, Speed; with Heart rate, bpm in the y-axis. The x-axis shows values from 0 to 1847. The y-axis shows values from 75.33333333333333 to 188.66666666666666. This visualization has the following annotations: Taking off; Unloading and carrying the glider; Driving up to Chabre take-off; Getting nervous before landing; Flaring and carrying; Driving up, rigging up and then rather exhausting endless low saving