Edit chart
Loading graph
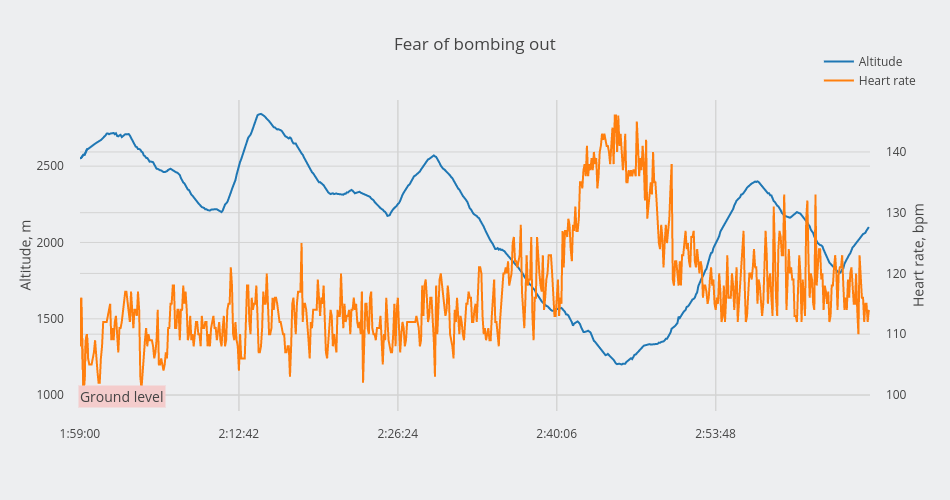
Alexandraserebrennikova's interactive graph and data of "Fear of bombing out" is a scatter chart, showing Altitude vs Heart rate; with Altitude, m in the y-axis. The x-axis shows values from 0 to 681. The y-axis shows values from 900 to 2933.1666666666665. This visualization has the following annotation: Ground level