Edit chart
Loading graph
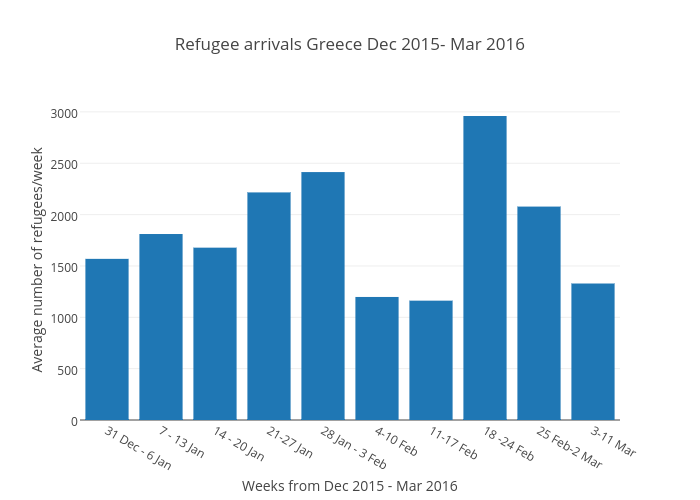
Amandaternblad's interactive graph and data of "Refugee arrivals Greece Dec 2015- Mar 2016" is a bar chart, showing Col2; with Weeks from Dec 2015 - Mar 2016 in the x-axis and Average number of refugees/week in the y-axis.. The x-axis shows values from -0.5 to 9.5. The y-axis shows values from 0 to 3115.7894736842104.