Edit chart
Loading graph
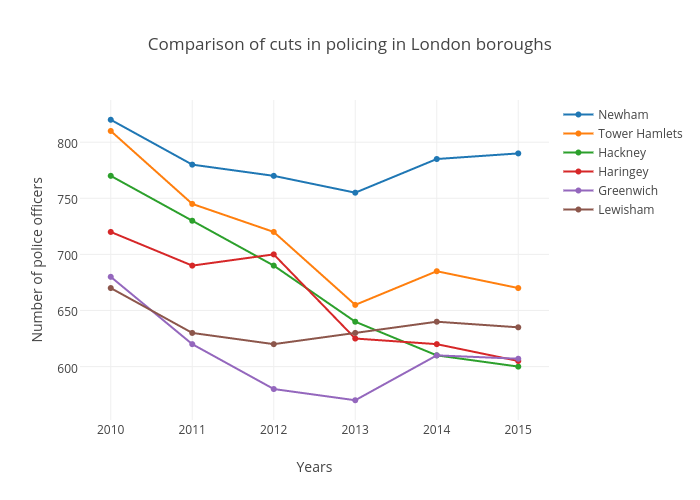
Amandaternblad's interactive graph and data of "Comparison of cuts in policing in London boroughs" is a scatter chart, showing Newham, Tower Hamlets, Hackney, Haringey, Greenwich, Lewisham; with Years in the x-axis and Number of police officers in the y-axis.. The x-axis shows values from 2009.633027522936 to 2015.366972477064. The y-axis shows values from 552.3855507868384 to 837.6144492131616.