Edit chart
Loading graph
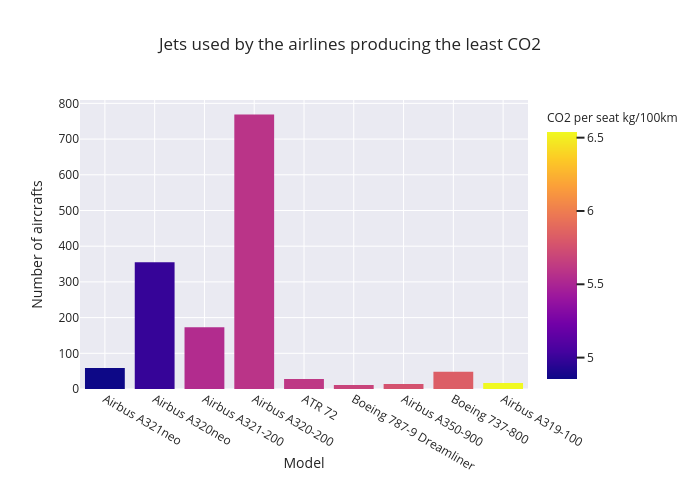
Andreascalisi's interactive graph and data of "Jets used by the airlines producing the least CO2" is a bar chart; with Model in the x-axis and Number of aircrafts in the y-axis.. The x-axis shows values from -0.5 to 8.5. The y-axis shows values from 0 to 809.4736842105264.