Edit chart
Loading graph
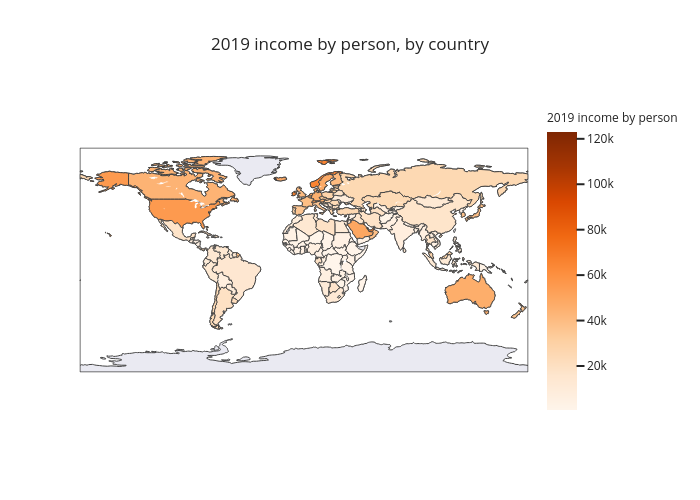
Andreascalisi's interactive graph and data of "2019 income by person, by country" is a choropleth. The x-axis shows values from -1 to 6. The y-axis shows values from -1 to 4.