Edit chart
Loading graph
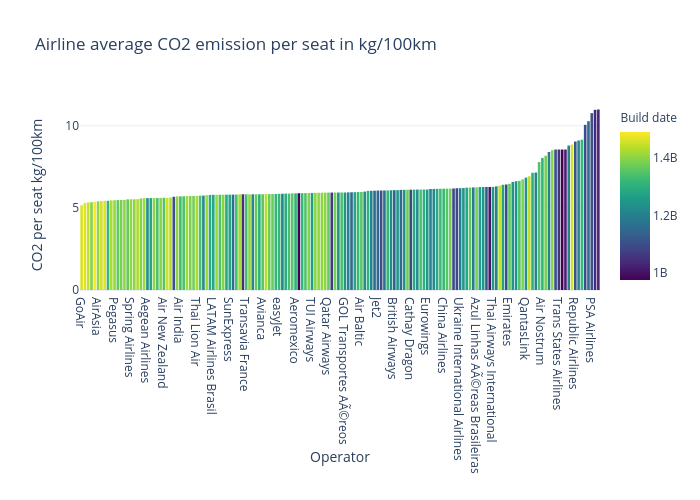
Andreascalisi's interactive graph and data of "Airline average CO2 emission per seat in kg/100km" is a bar chart; with Operator in the x-axis and CO2 per seat kg/100km in the y-axis.. The x-axis shows values from -0.5 to 157.5. The y-axis shows values from 0 to 11.57228564210527.