Edit chart
Loading graph
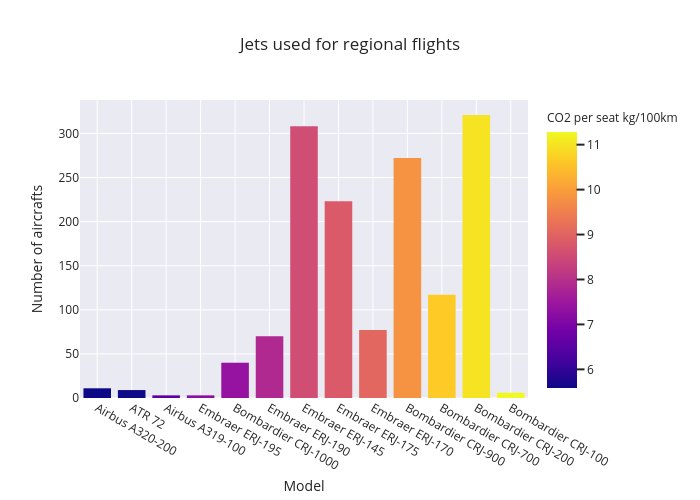
Andreascalisi's interactive graph and data of "Jets used for regional flights" is a bar chart; with Model in the x-axis and Number of aircrafts in the y-axis.. The x-axis shows values from -0.5 to 12.5. The y-axis shows values from 0 to 337.89473684210526.