Edit chart
Loading graph
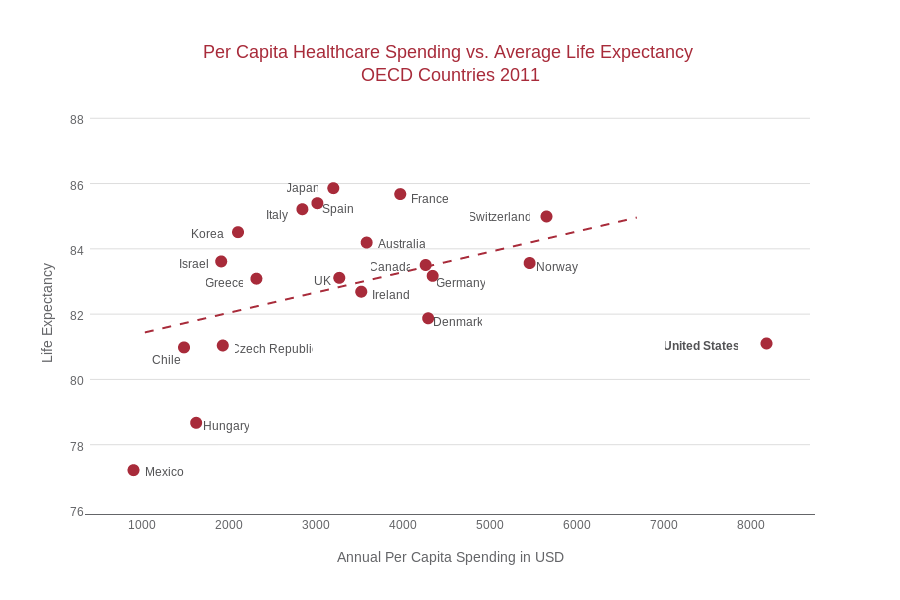
Annag's interactive graph and data of "Per Capita Healthcare Spending vs. Average Life Expectancy OECD Countries 2011" is a scatter chart, showing Life Expectancy vs Linear Trendline; with Annual Per Capita Spending in USD in the x-axis and Life Expectancy in the y-axis.. The x-axis shows values from 407.361565027551 to 8678.961882307583. The y-axis shows values from 76 to 88.1. This visualization has the following annotations: Mexico; Hungary; Chile; Czech Republic; Greece; Israel; Korea; Italy; Spain; Japan; France; Switzerland; Australia; Canada; Germany; Norway; UK; Ireland; Denmark; United States