Edit chart
Loading graph
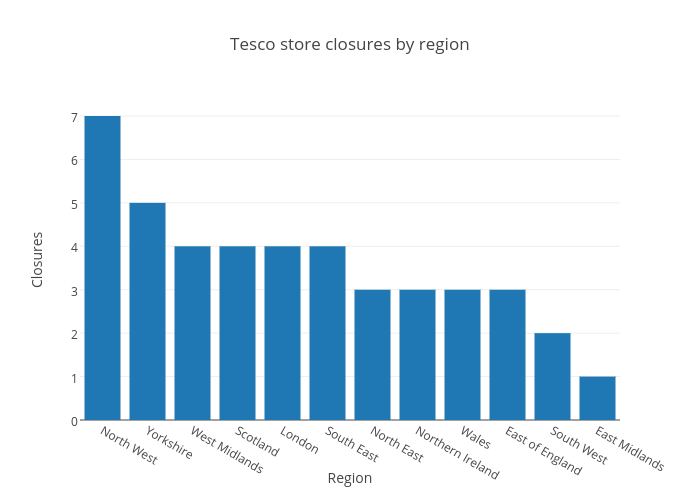
Ashleykirk's interactive graph and data of "Tesco store closures by region" is a bar chart, showing Closures; with Region in the x-axis and Closures in the y-axis.. The x-axis shows values from -0.5 to 11.5. The y-axis shows values from 0 to 7.368421052631579.