Edit chart
Loading graph
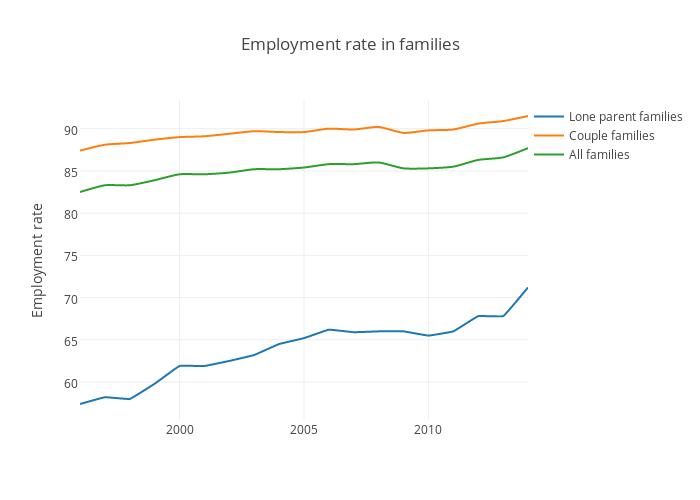
Ashleykirk's interactive graph and data of "Employment rate in families" is a line chart, showing Lone parent families, Couple families, All families; with time in the x-axis and Employment rate in the y-axis.. The x-axis shows values from 820454400000 to 1388534400000. The y-axis shows values from 55.50555555555555 to 93.39444444444445.