1880
1885
1890
1895
1900
1905
1910
1915
1920
1925
1930
1935
1940
1945
1950
1955
1960
1965
1970
1975
1980
1985
1990
1995
2000
2005
2010
2015
−0.4
−0.2
0
0.2
0.4
0.6
0.8
1°C
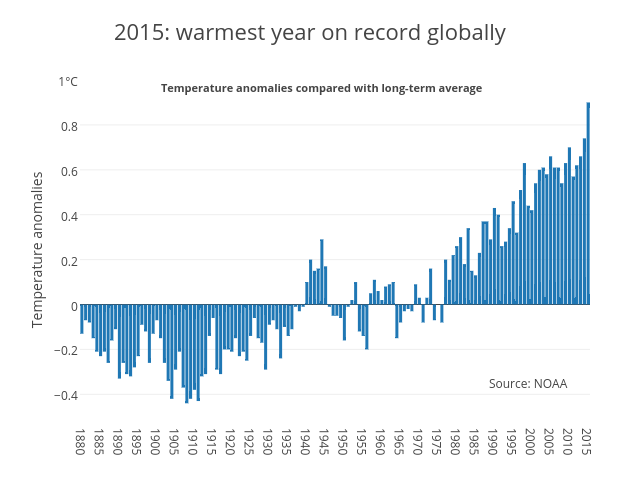
2015: warmest year on record globally
Temperature anomalies
Temperature anomalies compared with long-term average
Source: NOAA
plotly-logomark
Edit chart
Bkilmartinit's interactive graph and data of "2015: warmest year on record globally" is a bar chart, showing Temperature anomalies compared with long-term average; with Temperature anomalies in the y-axis. The x-axis shows values from 1879.5 to 2015.5. The y-axis shows values from -0.5144444444444445 to 1. This visualization has the following annotations: Temperature anomalies compared with long-term average; Source: NOAA