Edit chart
Loading graph
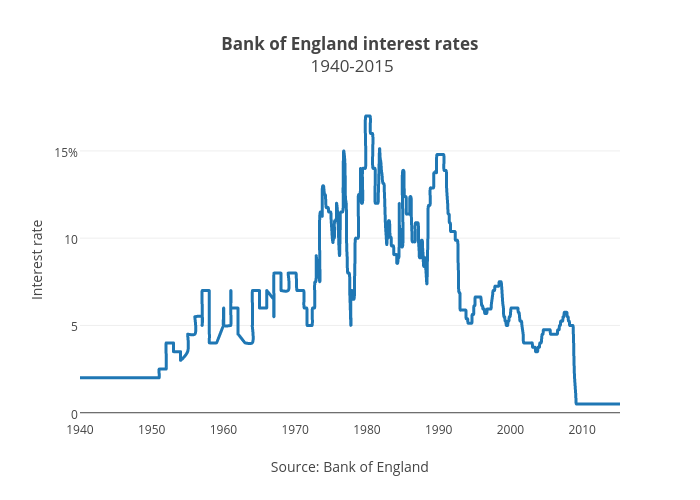
Bkilmartinit's interactive graph and data of "Bank of England interest rates 1940-2015" is a scatter chart, showing Interest rate; with Source: Bank of England in the x-axis and Interest rate in the y-axis.. The x-axis shows values from -946771200000 to 1427842800000. The y-axis shows values from -0.41666666666666685 to 17.916666666666668.