Edit chart
Loading graph
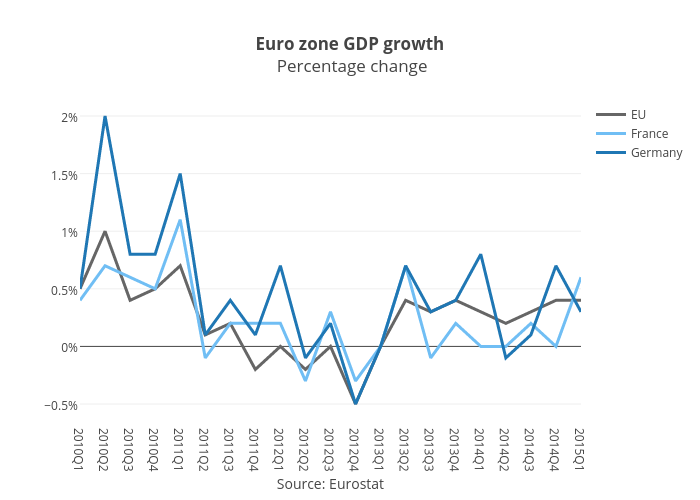
Bkilmartinit's interactive graph and data of "Euro zone GDP growth Percentage change" is a scatter chart, showing EU, France, Germany ; with Source: Eurostat in the x-axis. The x-axis shows values from 0 to 20. The y-axis shows values from -0.6388888888888888 to 2.138888888888889.