Edit chart
Loading graph
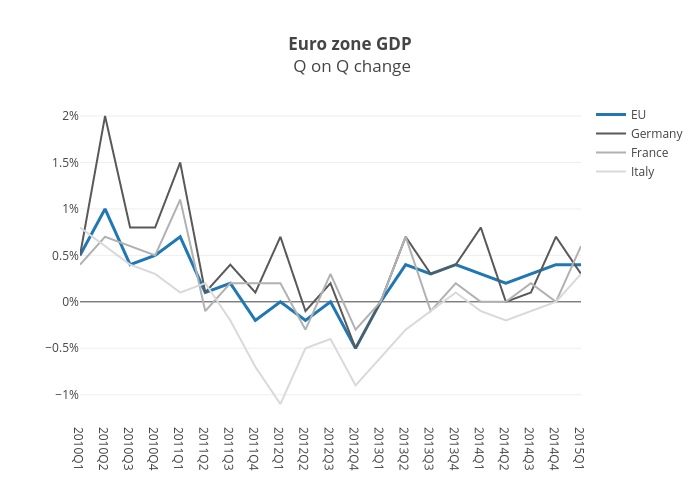
Bkilmartinit's interactive graph and data of "Euro zone GDP Q on Q change" is a scatter chart, showing EU, Germany, France, Italy. The x-axis shows values from 0 to 20. The y-axis shows values from -1.2722222222222224 to 2.172222222222222.