Edit chart
Loading graph
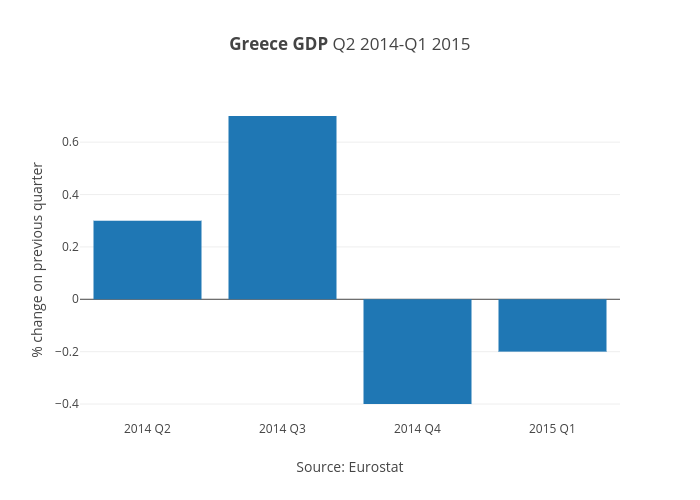
Bkilmartinit's interactive graph and data of "Greece GDP Q2 2014-Q1 2015" is a bar chart, showing % change of previous quarter; with Source: Eurostat in the x-axis and % change on previous quarter in the y-axis.. The x-axis shows values from -0.5 to 3.5. The y-axis shows values from -0.46111111111111114 to 0.7611111111111111.