Edit chart
Loading graph
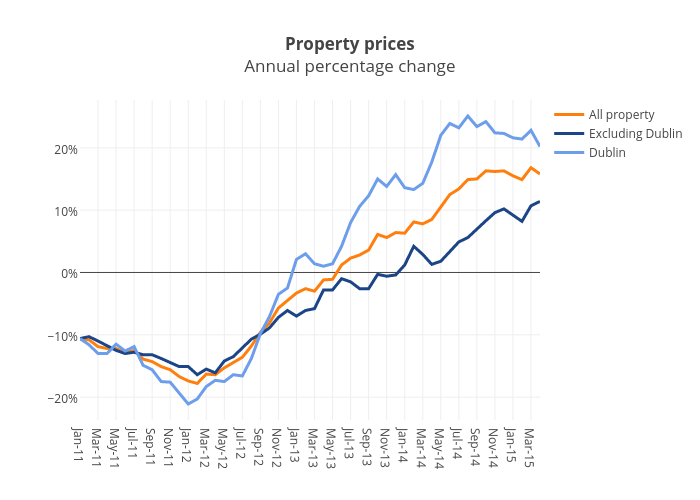
Bkilmartinit's interactive graph and data of "Property pricesAnnual percentage change" is a scatter chart, showing All property, Excluding Dublin, Dublin. The x-axis shows values from 0 to 51. The y-axis shows values from -23.666666666666668 to 27.666666666666668.