Edit chart
Loading graph
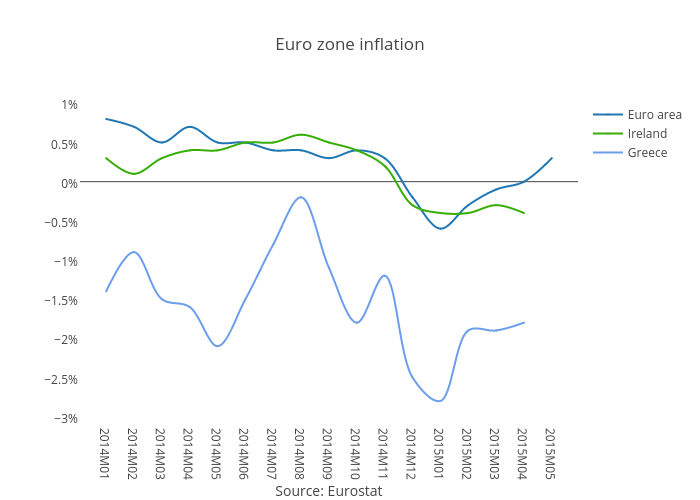
Bkilmartinit's interactive graph and data of "Euro zone inflation " is a scatter chart, showing Euro area, Ireland, Greece; with Source: Eurostat in the x-axis. The x-axis shows values from -0.94 to 16.940583502956287. The y-axis shows values from -3.026437541308658 to 1.0264375413086584.