Edit chart
Loading graph
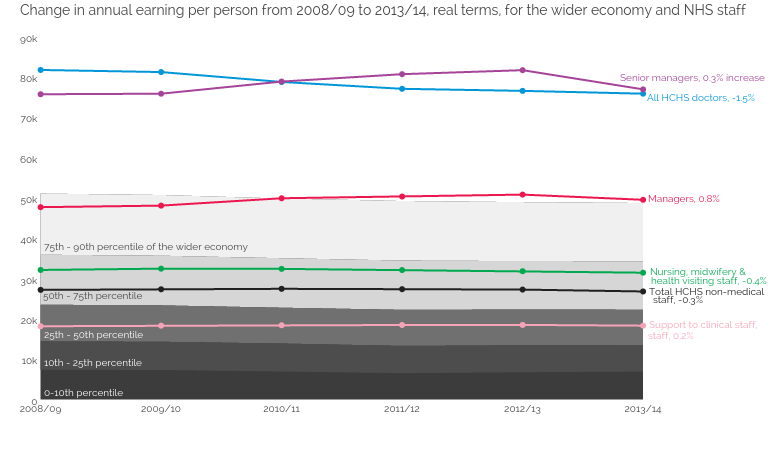
Bengershlick's interactive graph and data of "0-10th percentile, 75th - 90th percentile, 50th - 75th percentile, 25th - 50th percentile, 10th - 25th percentile, All HCHS doctors, Total HCHS non-medical staff, Qualified nursing, midwifery & health visiting staff, Support to clinical staff, Senior managers, Managers" is a filled , showing 0-10th percentile, 75th - 90th percentile, 50th - 75th percentile, 25th - 50th percentile, 10th - 25th percentile, All HCHS doctors, Total HCHS non-medical staff, Qualified nursing, midwifery & health visiting staff, Support to clinical staff, Senior managers, Managers. The x-axis shows values from -0.337 to 6.053172593733968. The y-axis shows values from -124.20997339297628 to 99062.8196400139. This visualization has the following annotations: Senior managers, 0.3% increase; All HCHS doctors, -1.5%; Managers, 0.8%; Nursing, midwifery & ; Total HCHS non-medical; Support to clinical staff, ; health visiting staff, -0.4%; staff, 0.2%; staff, -0.3%; 75th - 90th percentile of the wider economy; 50th - 75th percentile; 25th - 50th percentile; 10th - 25th percentile; 0-10th percentile; Change in annual earning per person from 2008/09 to 2013/14, real terms, for the wider economy and NHS staff