Edit chart
Loading graph
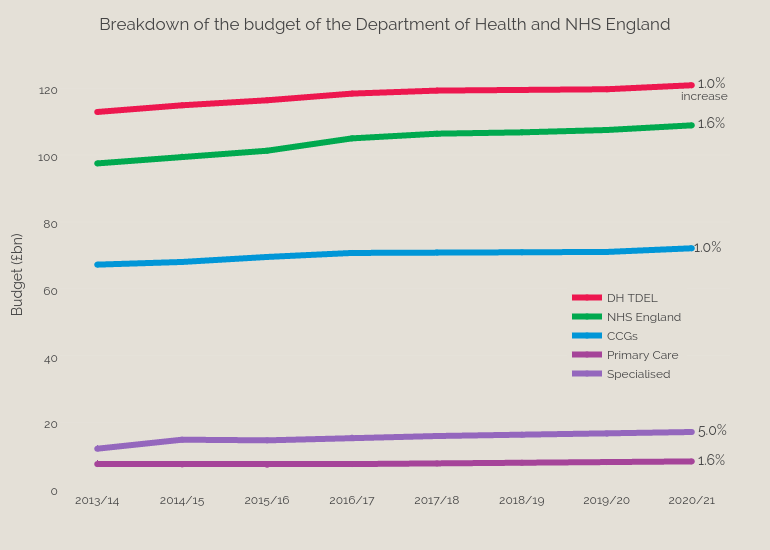
Bengershlick's interactive graph and data of "Breakdown of the budget of the Department of Health and NHS England" is a scatter chart, showing DH TDEL, NHS England, CCGs, Primary Care, Specialised; with Budget (£bn) in the y-axis. The x-axis shows values from -0.43858343151829454 to 7.4500313098845865. The y-axis shows values from -0.2583662714097503 to 128.45836627140974. This visualization has the following annotations: 1.0%; 1.6%; 5.0%; 1.0%; 1.6%; increase