Edit chart
Loading graph
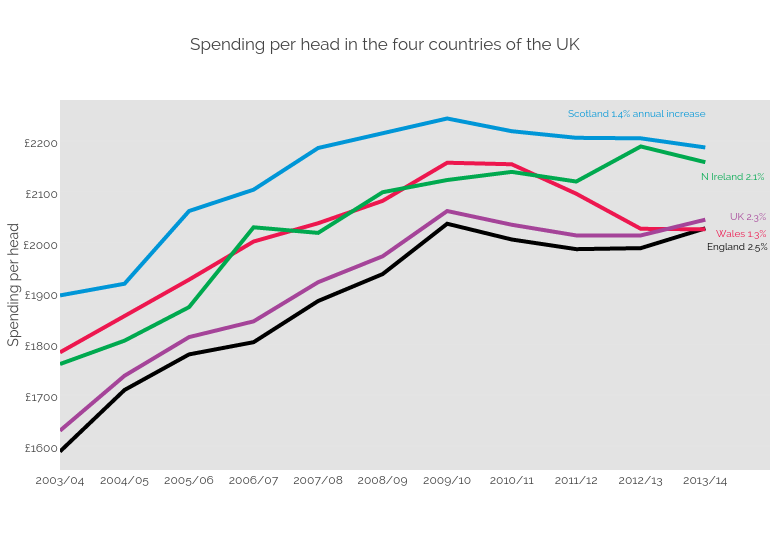
Bengershlick's interactive graph and data of "Spending per head in the four countries of the UK" is a line chart, showing England, Scotland, Wales, Northern Ireland, UK; with Spending per head in the y-axis. The x-axis shows values from 0 to 11.002252036324109. The y-axis shows values from 1552.611111111111 to 2280.3888888888887. This visualization has the following annotations: England 2.5%; UK 2.3%; Wales 1.3%; N Ireland 2.1%; Scotland 1.4% annual increase