Edit chart
Loading graph
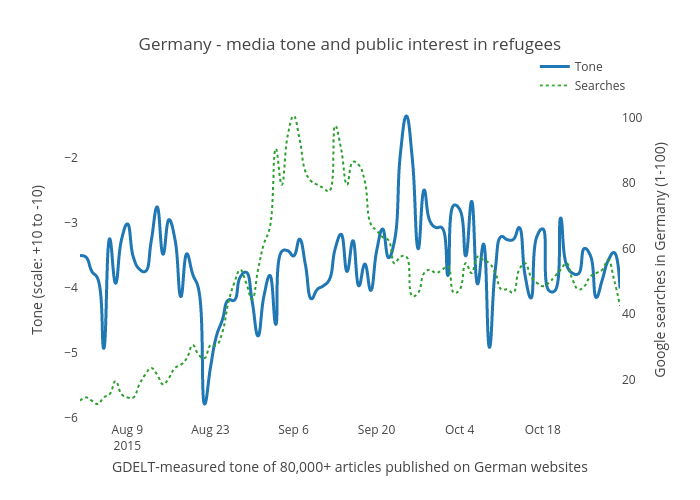
Benparker140's interactive graph and data of "Germany - media tone and public interest in refugees" is a scatter chart, showing Tone vs Searches; with GDELT-measured tone of 80,000+ articles published on German websites in the x-axis and Tone (scale: +10 to -10) in the y-axis.. The x-axis shows values from 1438383600000 to 1446249600000. The y-axis shows values from -6.0584772641111115 to -1.145943181888889.