Edit chart
Loading graph
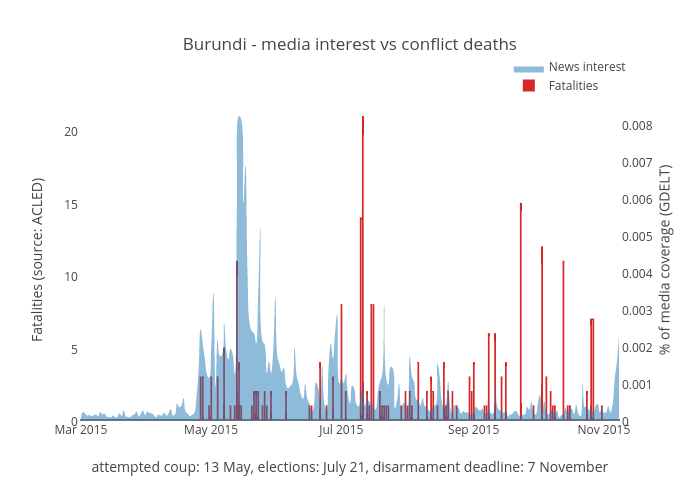
Benparker140's interactive graph and data of "Burundi - media interest vs conflict deaths" is a filled grouped bar chart, showing Fatalities vs News interest; with attempted coup: 13 May, elections: July 21, disarmament deadline: 7 November in the x-axis and Fatalities (source: ACLED) in the y-axis.. The x-axis shows values from 1425168000000 to 1446940800000. The y-axis shows values from 0 to 22.105263157894736.