Edit chart
Loading graph
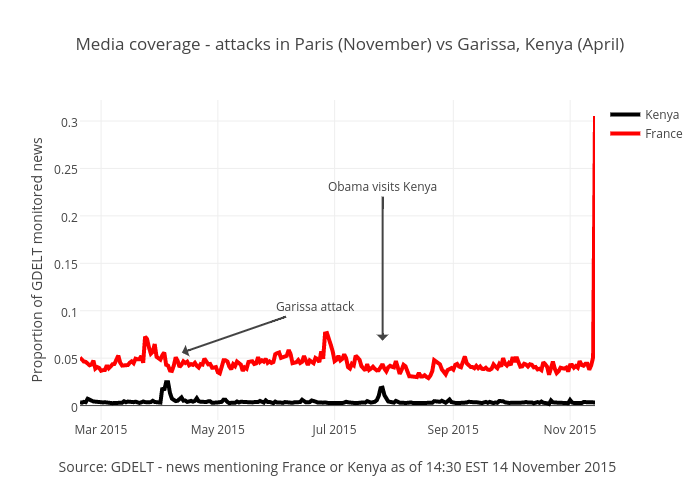
Benparker140's interactive graph and data of "Media coverage - attacks in Paris (November) vs Garissa, Kenya (April)" is a scatter chart, showing Kenya vs France; with Source: GDELT - news mentioning France or Kenya as of 14:30 EST 14 November 2015 in the x-axis and Proportion of GDELT monitored news in the y-axis.. The x-axis shows values from 1424217600000 to 1447459200000. The y-axis shows values from -0.015213134261055552 to 0.32219702654005555. This visualization has the following annotations: Garissa attack; Obama visits Kenya