Edit chart
Loading graph
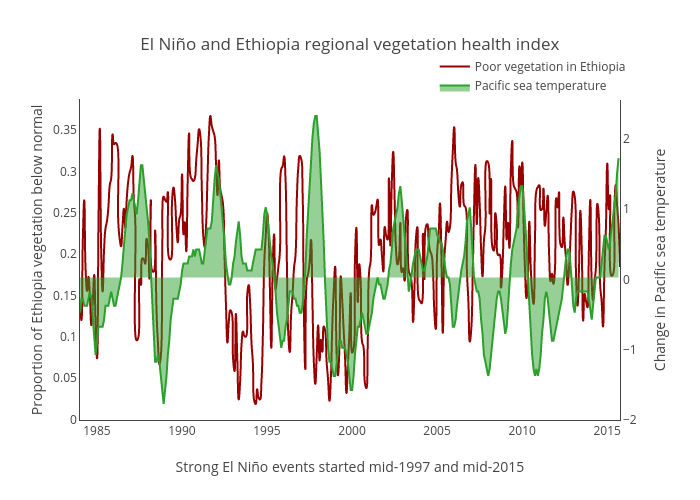
Benparker140's interactive graph and data of "El Niño and Ethiopia regional vegetation health index" is a scatter chart, showing Poor vegetation in Ethiopia vs Pacific sea temperature; with Strong El Niño events started mid-1997 and mid-2015 in the x-axis and Proportion of Ethiopia vegetation below normal in the y-axis.. The x-axis shows values from 441763200000 to 1443654000000. The y-axis shows values from -0.002564821653378256 to 0.38400619912441375.