Edit chart
Loading graph
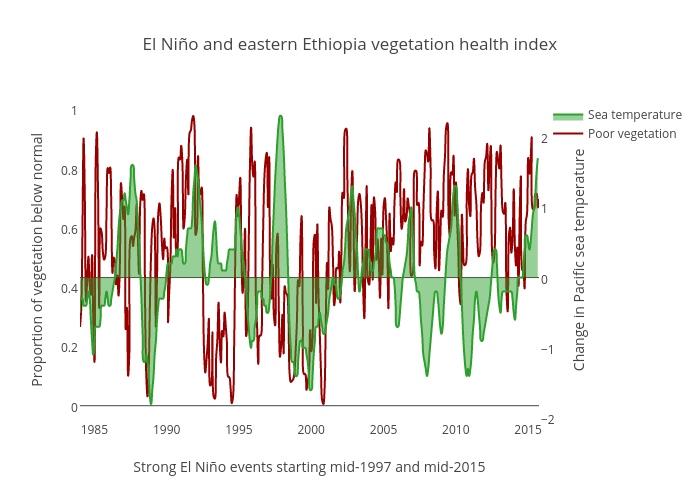
Benparker140's interactive graph and data of "El Niño and eastern Ethiopia vegetation health index" is a filled scatter chart, showing Sea temperature vs Poor vegetation; with Strong El Niño events starting mid-1997 and mid-2015 in the x-axis and Proportion of vegetation below normal in the y-axis.. The x-axis shows values from 441763200000 to 1443654000000. The y-axis shows values from -0.04823933245012093 to 1.0310199248924448.