Edit chart
Loading graph
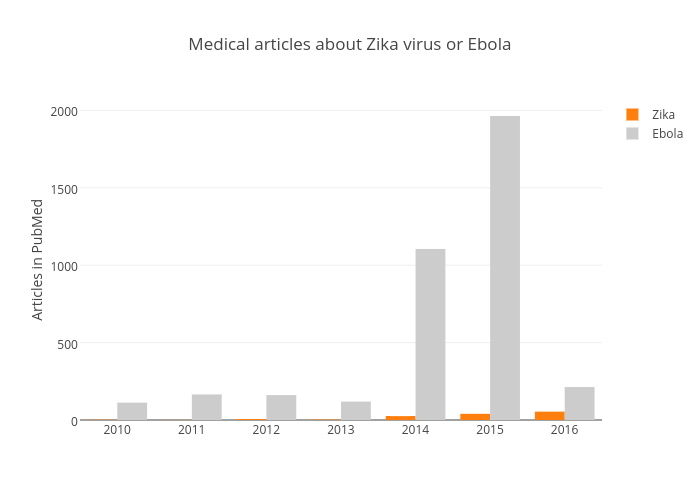
Benparker140's interactive graph and data of "Medical articles about Zika virus or Ebola" is a bar chart, showing Zika vs Ebola; with Articles in PubMed in the y-axis. The x-axis shows values from 2009.5 to 2016.5. The y-axis shows values from 0 to 2067.3684210526317.