Edit chart
Loading graph
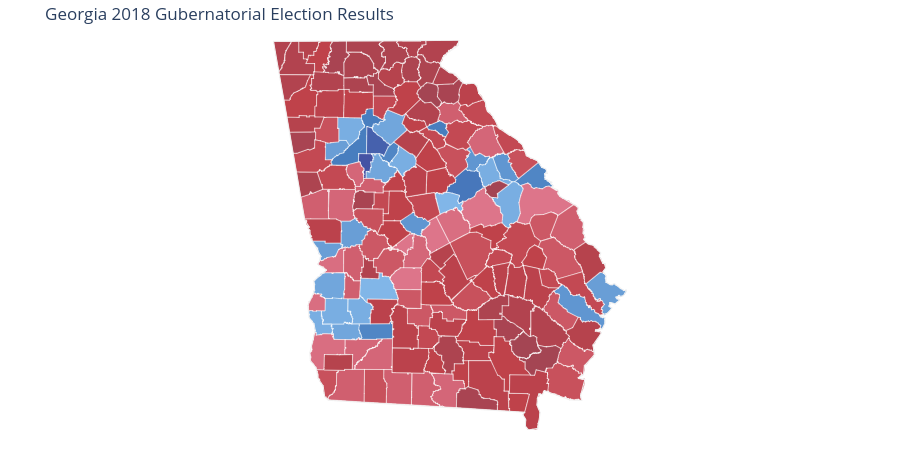
Berkeleypoliticalreview's interactive graph and data of "Georgia 2018 Gubernatorial Election Results" is a filled line chart, showing 91.39, US Counties. The x-axis shows values from -89.0262815 to -77.41926149999999. The y-axis shows values from 30.357851 to 35.000659. This visualization has the following annotation: