Edit chart
Loading graph
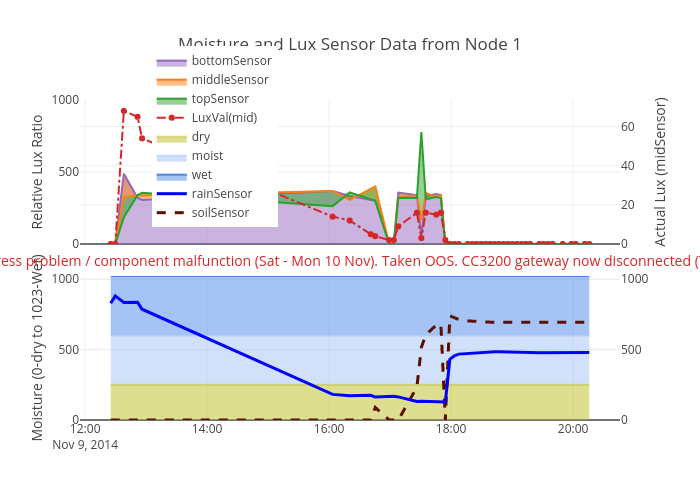
Bigg's interactive graph and data of "Moisture and Lux Sensor Data from Node 1" is a filled scatter chart, showing bottomSensor, middleSensor, topSensor, LuxVal(mid), dry, moist, wet, rainSensor, soilSensor; with time in the x-axis and Moisture (0-dry to 1023-Wet) in the y-axis.. The x-axis shows values from 1415534208106.6042 to 1415565855368.3958. The y-axis shows values from 0 to 1023. This visualization has the following annotation: Moisture Ingress problem / component malfunction (Sat - Mon 10 Nov). Taken OOS. CC3200 gateway now disconnected (Tues 11 Nov)