Edit chart
Loading graph
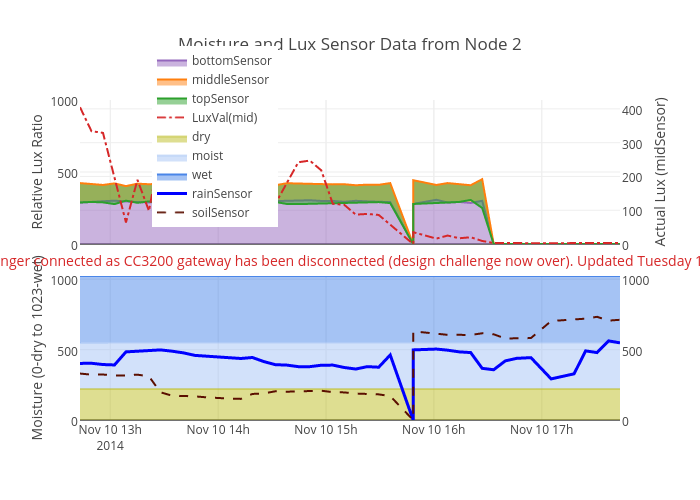
Bigg's interactive graph and data of "Moisture and Lux Sensor Data from Node 2" is a filled scatter chart, showing bottomSensor, middleSensor, topSensor, LuxVal(mid), dry, moist, wet, rainSensor, soilSensor; with time in the x-axis and Moisture (0-dry to 1023-wet) in the y-axis.. The x-axis shows values from 1415623387554 to 1415641411954. The y-axis shows values from 0 to 1023. This visualization has the following annotation: Node 2 no longer connected as CC3200 gateway has been disconnected (design challenge now over). Updated Tuesday 11 November